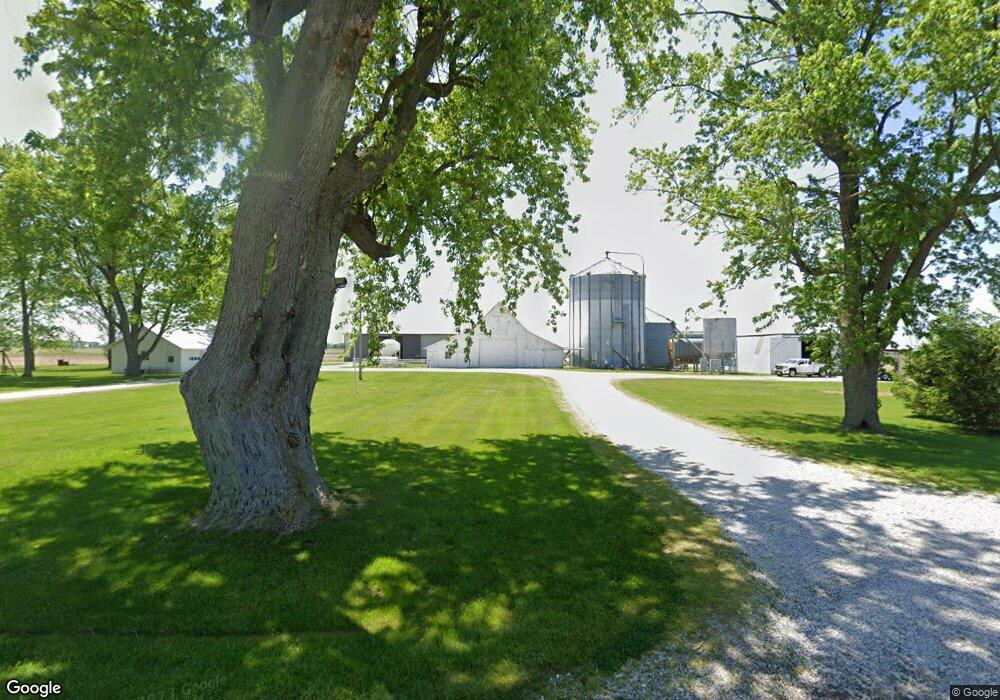
55 E 400 S Lebanon, IN 46052
Estimated Value: $278,000 - $767,314
4
Beds
2
Baths
2,520
Sq Ft
$231/Sq Ft
Est. Value
About This Home
This home is located at 55 E 400 S, Lebanon, IN 46052 and is currently estimated at $582,438, approximately $231 per square foot. 55 E 400 S is a home located in Boone County with nearby schools including Western Boone Junior/Senior High School.
Ownership History
Date
Name
Owned For
Owner Type
Purchase Details
Closed on
May 6, 2021
Sold by
Branaman Christopher L
Bought by
Branaman Christopher L and Christopher L Branaman Living
Current Estimated Value
Purchase Details
Closed on
Jan 24, 2008
Sold by
Maxwell Albert Wilson
Bought by
Branaman Christopher L
Home Financials for this Owner
Home Financials are based on the most recent Mortgage that was taken out on this home.
Original Mortgage
$100,500
Outstanding Balance
$63,756
Interest Rate
6.17%
Mortgage Type
Future Advance Clause Open End Mortgage
Estimated Equity
$518,682
Create a Home Valuation Report for This Property
The Home Valuation Report is an in-depth analysis detailing your home's value as well as a comparison with similar homes in the area
Home Values in the Area
Average Home Value in this Area
Purchase History
| Date | Buyer | Sale Price | Title Company |
|---|---|---|---|
| Branaman Christopher L | -- | Meridian Title | |
| Branaman Christopher L | -- | -- |
Source: Public Records
Mortgage History
| Date | Status | Borrower | Loan Amount |
|---|---|---|---|
| Open | Branaman Christopher L | $100,500 |
Source: Public Records
Tax History Compared to Growth
Tax History
| Year | Tax Paid | Tax Assessment Tax Assessment Total Assessment is a certain percentage of the fair market value that is determined by local assessors to be the total taxable value of land and additions on the property. | Land | Improvement |
|---|---|---|---|---|
| 2024 | $5,155 | $615,300 | $144,200 | $471,100 |
| 2023 | $5,088 | $587,700 | $124,500 | $463,200 |
| 2022 | $6,466 | $670,500 | $103,900 | $566,600 |
| 2021 | $5,824 | $571,200 | $92,400 | $478,800 |
| 2020 | $5,440 | $536,200 | $91,900 | $444,300 |
| 2019 | $5,117 | $510,600 | $106,200 | $404,400 |
| 2018 | $4,934 | $500,900 | $108,800 | $392,100 |
| 2017 | $4,658 | $491,100 | $121,000 | $370,100 |
| 2016 | $4,231 | $469,800 | $126,200 | $343,600 |
| 2014 | $3,581 | $431,400 | $137,700 | $293,700 |
| 2013 | $2,775 | $318,600 | $121,900 | $196,700 |
Source: Public Records
Map
Nearby Homes