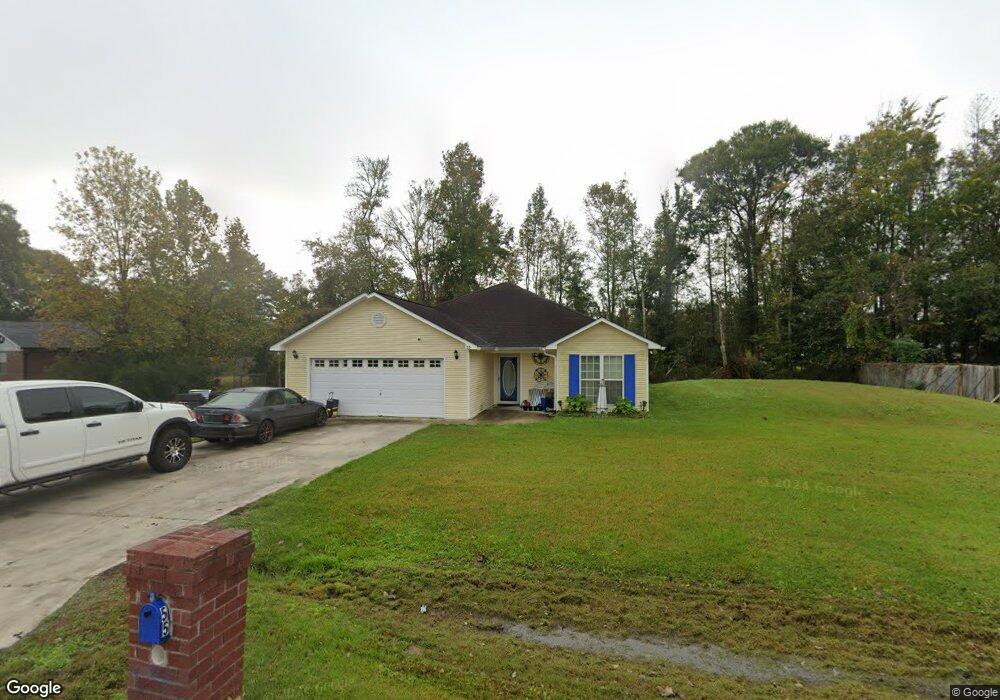
55 E Beaver Ln Midway, GA 31320
Estimated Value: $228,000 - $265,000
3
Beds
2
Baths
1,436
Sq Ft
$172/Sq Ft
Est. Value
About This Home
This home is located at 55 E Beaver Ln, Midway, GA 31320 and is currently estimated at $247,496, approximately $172 per square foot. 55 E Beaver Ln is a home located in Liberty County with nearby schools including Liberty Elementary School, Midway Middle School, and Liberty County High School.
Ownership History
Date
Name
Owned For
Owner Type
Purchase Details
Closed on
Jun 7, 2013
Sold by
Sec Of Veterans Affa
Bought by
Watkins Aaron
Current Estimated Value
Purchase Details
Closed on
Dec 4, 2012
Sold by
Bank Of America
Bought by
Sec Of Veterans Affairs
Purchase Details
Closed on
Sep 9, 2005
Sold by
Aretino Joseph M
Bought by
Granger Henry
Home Financials for this Owner
Home Financials are based on the most recent Mortgage that was taken out on this home.
Original Mortgage
$119,828
Interest Rate
5.86%
Mortgage Type
VA
Purchase Details
Closed on
Oct 1, 2004
Sold by
Obro Inc
Bought by
Aretino Joseph M and Aretino Nancy C
Purchase Details
Closed on
Jun 23, 2004
Sold by
Bryan Bank & Trust
Bought by
Obro Inc
Purchase Details
Closed on
Jun 3, 2004
Sold by
Dykes & Hadwin Inc
Bought by
Obro Inc
Purchase Details
Closed on
Jun 13, 1994
Bought by
Dykes Lenard and Dykes Arden
Create a Home Valuation Report for This Property
The Home Valuation Report is an in-depth analysis detailing your home's value as well as a comparison with similar homes in the area
Purchase History
| Date | Buyer | Sale Price | Title Company |
|---|---|---|---|
| Watkins Aaron | $60,000 | -- | |
| Sec Of Veterans Affairs | $92,537 | -- | |
| Bank Of America | $92,537 | -- | |
| Granger Henry | $116,000 | -- | |
| Aretino Joseph M | $98,500 | -- | |
| Obro Inc | -- | -- | |
| Obro Inc | $42,000 | -- | |
| Dykes Lenard | -- | -- |
Source: Public Records
Mortgage History
| Date | Status | Borrower | Loan Amount |
|---|---|---|---|
| Previous Owner | Granger Henry | $119,828 |
Source: Public Records
Tax History
| Year | Tax Paid | Tax Assessment Tax Assessment Total Assessment is a certain percentage of the fair market value that is determined by local assessors to be the total taxable value of land and additions on the property. | Land | Improvement |
|---|---|---|---|---|
| 2025 | $3,434 | $82,255 | $20,000 | $62,255 |
| 2024 | $3,435 | $81,089 | $14,000 | $67,089 |
| 2023 | $3,393 | $71,266 | $12,000 | $59,266 |
| 2022 | $2,172 | $55,120 | $10,800 | $44,320 |
| 2021 | $2,001 | $50,864 | $10,800 | $40,064 |
| 2020 | $2,024 | $51,324 | $10,800 | $40,524 |
| 2019 | $1,806 | $46,886 | $10,000 | $36,886 |
| 2018 | $1,800 | $47,301 | $10,000 | $37,301 |
| 2017 | $1,940 | $45,715 | $8,000 | $37,715 |
| 2016 | $1,638 | $46,130 | $8,000 | $38,130 |
| 2015 | $884 | $46,130 | $8,000 | $38,130 |
| 2014 | $884 | $54,467 | $10,000 | $44,467 |
| 2013 | -- | $51,172 | $10,000 | $41,172 |
Source: Public Records
Map
Nearby Homes
- 12 E Red Fox Ct
- 35 W Red Fox Ct
- 48 W Beaver Ln
- 146 River Bend Dr
- 327 River Bend Dr
- 29 Arlen Dr
- 0 E Oglethorpe Unit SA341930
- 0 E Oglethorpe Unit 153327
- 0 E Oglethorpe Unit 10592168
- 0 E Oglethorpe Unit SA350017
- 0 E Oglethorpe Unit SA350025
- 8701 E Oglethorpe Hwy
- 46 Delaney Ct
- 260 Arlen Dr
- 0000 E Oglethorpe Hwy
- 182 Gloucester Dr
- 0 S Coastal Hwy
- 29 Sassafras Ln
- 135 Kettle Creek Ln
- 51 Lachlan Ln
- 33 E Beaver Ln
- 81 E Beaver Ln
- 56 E Red Fox Ct
- E E Beaver Ln
- 78 E Red Fox Ct
- 34 E Red Fox Ct
- 56 E Beaver Ln
- 34 E Beaver Ln
- 11 E Beaver Ln
- 93 E Beaver Ln
- 82 E Beaver Ln
- 100 E Red Fox Ct
- 12 E Beaver Ln
- 55 E Deer Ct
- 55 E Red Fox Ct
- 33 E Deer Ct
- 77 E Red Fox Ct
- 77 E Deer Ct
- 33 E Red Fox Ct
- 128 E Red Fox Ct
Your Personal Tour Guide
Ask me questions while you tour the home.