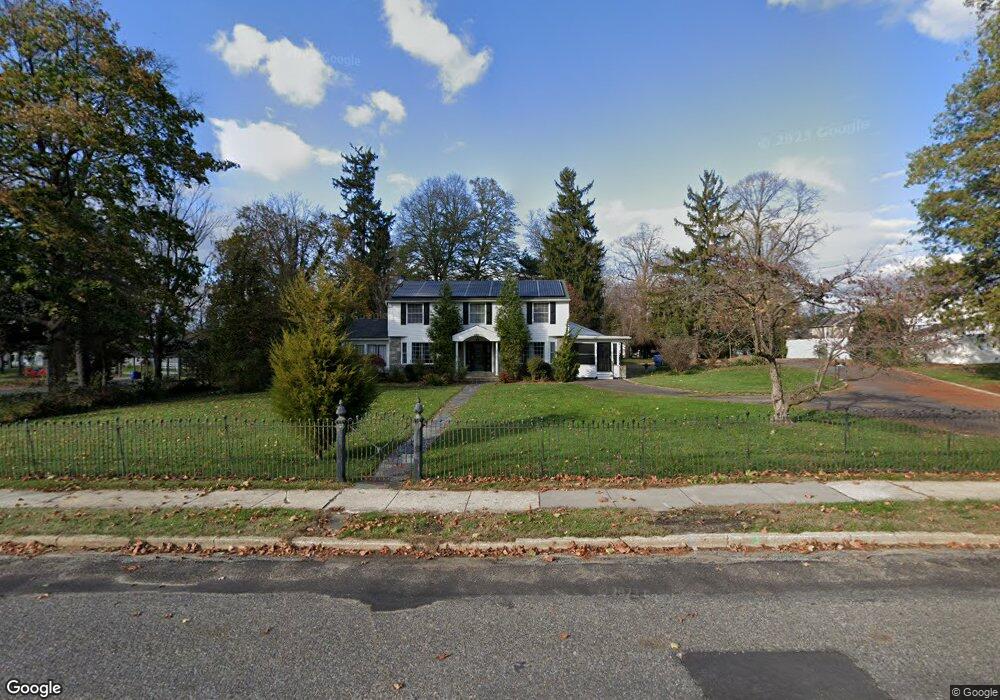
55 E High St Clayton, NJ 08312
Estimated Value: $379,000 - $469,342
3
Beds
3
Baths
3,259
Sq Ft
$129/Sq Ft
Est. Value
About This Home
This home is located at 55 E High St, Clayton, NJ 08312 and is currently estimated at $420,586, approximately $129 per square foot. 55 E High St is a home located in Gloucester County with nearby schools including Herma S. Simmons Elementary School, Clayton Middle School, and Clayton High School.
Ownership History
Date
Name
Owned For
Owner Type
Purchase Details
Closed on
Sep 16, 2005
Sold by
Castagna Victor and Castagna Construction
Bought by
Simrell Keith and Fajardo Simrell Rhoda
Current Estimated Value
Home Financials for this Owner
Home Financials are based on the most recent Mortgage that was taken out on this home.
Original Mortgage
$277,875
Outstanding Balance
$176,089
Interest Rate
8.95%
Mortgage Type
Fannie Mae Freddie Mac
Estimated Equity
$244,497
Purchase Details
Closed on
Apr 21, 2005
Sold by
Doughty Clara
Bought by
Castagna Victor and Castagna Construction
Home Financials for this Owner
Home Financials are based on the most recent Mortgage that was taken out on this home.
Original Mortgage
$365,000
Interest Rate
5.83%
Mortgage Type
Construction
Create a Home Valuation Report for This Property
The Home Valuation Report is an in-depth analysis detailing your home's value as well as a comparison with similar homes in the area
Home Values in the Area
Average Home Value in this Area
Purchase History
| Date | Buyer | Sale Price | Title Company |
|---|---|---|---|
| Simrell Keith | $292,500 | Safeguard Title | |
| Castagna Victor | $365,000 | Commonwealth Land Title Insu |
Source: Public Records
Mortgage History
| Date | Status | Borrower | Loan Amount |
|---|---|---|---|
| Open | Simrell Keith | $277,875 | |
| Previous Owner | Castagna Victor | $365,000 |
Source: Public Records
Tax History
| Year | Tax Paid | Tax Assessment Tax Assessment Total Assessment is a certain percentage of the fair market value that is determined by local assessors to be the total taxable value of land and additions on the property. | Land | Improvement |
|---|---|---|---|---|
| 2025 | $8,873 | $358,500 | $95,200 | $263,300 |
| 2024 | $8,284 | $358,500 | $95,200 | $263,300 |
| 2023 | $8,284 | $205,000 | $57,800 | $147,200 |
| 2022 | $8,194 | $205,000 | $57,800 | $147,200 |
| 2021 | $8,095 | $205,000 | $57,800 | $147,200 |
| 2020 | $8,112 | $205,000 | $57,800 | $147,200 |
| 2019 | $7,916 | $205,000 | $57,800 | $147,200 |
| 2018 | $7,804 | $205,000 | $57,800 | $147,200 |
| 2017 | $7,672 | $205,000 | $57,800 | $147,200 |
| 2016 | $7,591 | $205,000 | $57,800 | $147,200 |
| 2015 | $7,367 | $205,000 | $57,800 | $147,200 |
| 2014 | $7,093 | $204,500 | $57,300 | $147,200 |
Source: Public Records
Map
Nearby Homes
- 26 W Center St
- 104 Maple St
- 000 N Pearl St
- 0 N Pearl St
- 238 W Center St
- 106 W Clinton St
- 132 W Clinton St
- 100 Aura Rd Unit 206
- 100 Aura Rd Unit 311
- 100 Aura Rd Unit 110
- 100 Aura Rd Unit 212
- 100 Aura Rd Unit 410
- 7 Hawthorn Way
- 124 W Howard St
- 60 Roberts Ave
- 554 Bellview Ave
- 237 S Delsea Dr
- 520 Coleman Dr
- 580 Sunhaven Dr
- 538 Lynne Dr
- 57 E High St
- 202 N Main St
- 204 N Main St
- 59 E High St
- 206 N Main St Unit B
- 206 N Main St Unit A
- 206 N Main St
- 54 E High St
- 17 E High St
- 50 E High St
- 40 E High St
- 214 N Main St
- 34 E High St
- 101 E High St
- 15 E High St Unit E
- 127 N Main St
- 58 E High St
- 117 N Main St
- 105 N Main St Unit C
- 105 N Main St Unit A
Your Personal Tour Guide
Ask me questions while you tour the home.