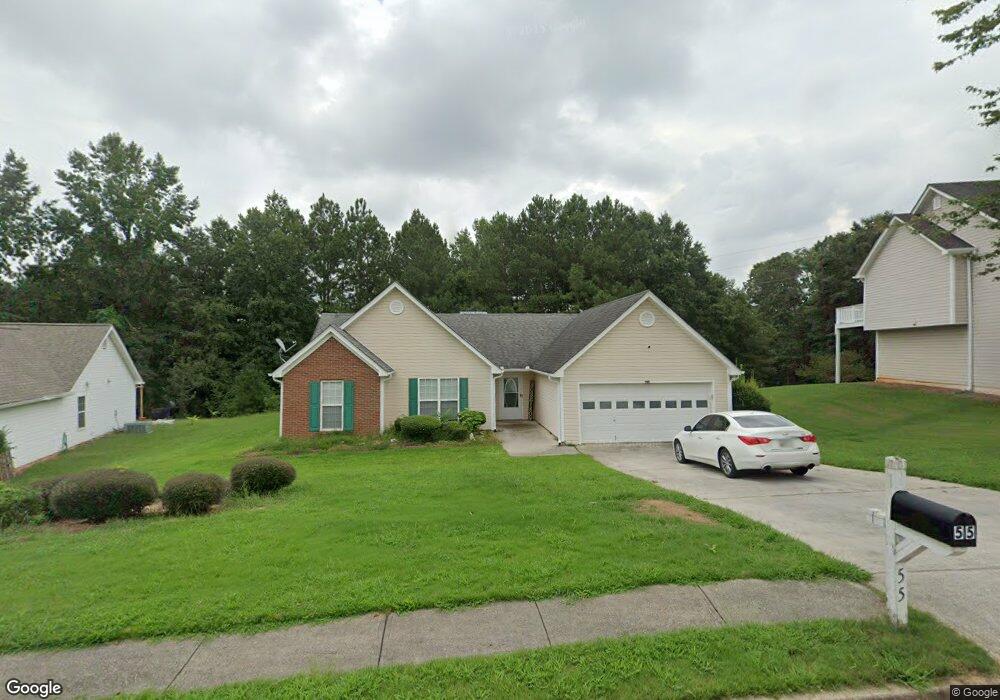
55 E Lawn Ct Covington, GA 30016
Estimated Value: $234,223 - $256,000
Studio
2
Baths
1,406
Sq Ft
$173/Sq Ft
Est. Value
About This Home
This home is located at 55 E Lawn Ct, Covington, GA 30016 and is currently estimated at $242,806, approximately $172 per square foot. 55 E Lawn Ct is a home located in Newton County with nearby schools including Porterdale Elementary School, Clements Middle School, and Newton High School.
Ownership History
Date
Name
Owned For
Owner Type
Purchase Details
Closed on
Mar 15, 2021
Sold by
James Teanna C
Bought by
Morrison Monty
Current Estimated Value
Home Financials for this Owner
Home Financials are based on the most recent Mortgage that was taken out on this home.
Original Mortgage
$186,558
Outstanding Balance
$166,181
Interest Rate
2.73%
Mortgage Type
FHA
Estimated Equity
$76,625
Purchase Details
Closed on
May 4, 2017
Sold by
Deemer Amberly B
Bought by
James Teanna C
Home Financials for this Owner
Home Financials are based on the most recent Mortgage that was taken out on this home.
Original Mortgage
$125,000
Interest Rate
4.1%
Mortgage Type
VA
Purchase Details
Closed on
Mar 28, 2002
Sold by
Elmo Fortenberry Builders
Bought by
Deemer Richard G and Deemer Amberly B
Home Financials for this Owner
Home Financials are based on the most recent Mortgage that was taken out on this home.
Original Mortgage
$119,622
Interest Rate
6.8%
Mortgage Type
FHA
Create a Home Valuation Report for This Property
The Home Valuation Report is an in-depth analysis detailing your home's value as well as a comparison with similar homes in the area
Home Values in the Area
Average Home Value in this Area
Purchase History
| Date | Buyer | Sale Price | Title Company |
|---|---|---|---|
| Morrison Monty | -- | -- | |
| James Teanna C | $125,000 | -- | |
| Deemer Richard G | $121,500 | -- |
Source: Public Records
Mortgage History
| Date | Status | Borrower | Loan Amount |
|---|---|---|---|
| Open | Morrison Monty | $186,558 | |
| Previous Owner | James Teanna C | $125,000 | |
| Previous Owner | Deemer Richard G | $119,622 |
Source: Public Records
Tax History
| Year | Tax Paid | Tax Assessment Tax Assessment Total Assessment is a certain percentage of the fair market value that is determined by local assessors to be the total taxable value of land and additions on the property. | Land | Improvement |
|---|---|---|---|---|
| 2025 | $2,121 | $87,560 | $15,200 | $72,360 |
| 2024 | $2,110 | $84,720 | $15,200 | $69,520 |
| 2023 | $2,472 | $92,680 | $8,000 | $84,680 |
| 2022 | $2,019 | $78,320 | $8,000 | $70,320 |
| 2021 | $1,596 | $54,480 | $8,000 | $46,480 |
| 2020 | $1,550 | $50,040 | $8,000 | $42,040 |
| 2019 | $1,563 | $49,720 | $8,000 | $41,720 |
| 2018 | $1,516 | $48,040 | $8,000 | $40,040 |
| 2017 | $1,367 | $43,720 | $5,600 | $38,120 |
| 2016 | $1,221 | $38,280 | $3,800 | $34,480 |
| 2015 | $1,152 | $36,280 | $3,400 | $32,880 |
| 2014 | $828 | $26,880 | $0 | $0 |
Source: Public Records
Map
Nearby Homes
- 80 E Lawn Dr
- 115 E Lawn Way
- 15 Beaverdam Ln
- 216 Upper River Rd
- 65 Beaverdam Ct
- 80 Beaverdam Ct
- 40 Tuesday Ct
- 290 Trelawney Dr
- 75 Havenwood Ln
- 11565 Brown Bridge Rd
- 0 Crowell Rd Unit 24687706
- 11637 Brown Bridge Rd
- 13 Manor Oak Dr
- 275 Trelawney Dr
- 450 Fieldstone Ln
- 106 Kirkland Rd
- 25 Kevin Ct
- 10 Heaton Dr
- 85 Austin Terrace Unit LOT 45
- 355 Heaton Rd
- 65 E Lawn Ct
- 45 E Lawn Ct
- E E Lawn Ct Unit 46
- E E Lawn Ct Unit 7
- E E Lawn Ct
- 60 E Lawn Ct
- 75 E Lawn Ct
- 35 E Lawn Ct Unit 46
- 35 E Lawn Ct
- 40 E Lawn Ct
- 50 Woodland Ridge Cir
- 80 E Lawn Ct
- 40 Woodland Ridge Cir
- 30 Woodland Ridge Cir Unit 5
- 85 E Lawn Ct
- 60 Woodland Ridge Cir
- 35 E Lawn Dr
- 15 E Lawn Ct
- 20 Woodland Ridge Cir
Your Personal Tour Guide
Ask me questions while you tour the home.