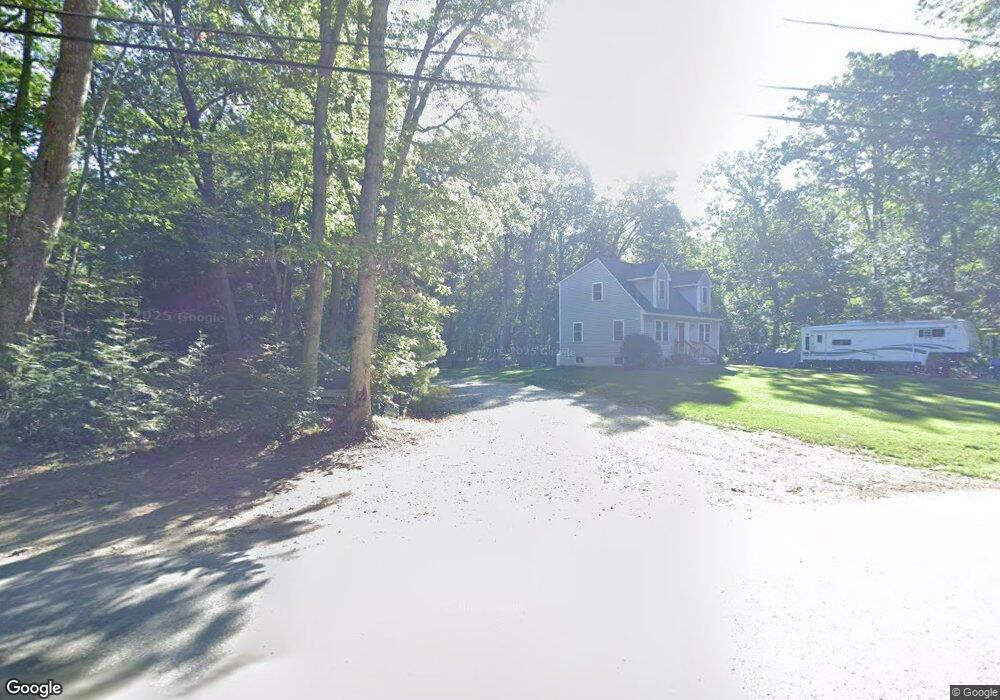
55 East St Pepperell, MA 01463
Estimated Value: $531,000 - $572,522
3
Beds
2
Baths
1,344
Sq Ft
$414/Sq Ft
Est. Value
About This Home
This home is located at 55 East St, Pepperell, MA 01463 and is currently estimated at $556,631, approximately $414 per square foot. 55 East St is a home located in Middlesex County with nearby schools including North Middlesex Regional High School, Pepperell Christian Academy, and Maple Dene & Moppet School.
Ownership History
Date
Name
Owned For
Owner Type
Purchase Details
Closed on
Feb 25, 2013
Sold by
H & G Rt
Bought by
Cook John
Current Estimated Value
Home Financials for this Owner
Home Financials are based on the most recent Mortgage that was taken out on this home.
Original Mortgage
$112,198
Outstanding Balance
$78,815
Interest Rate
3.44%
Mortgage Type
New Conventional
Estimated Equity
$477,816
Create a Home Valuation Report for This Property
The Home Valuation Report is an in-depth analysis detailing your home's value as well as a comparison with similar homes in the area
Home Values in the Area
Average Home Value in this Area
Purchase History
| Date | Buyer | Sale Price | Title Company |
|---|---|---|---|
| Cook John | $110,000 | -- |
Source: Public Records
Mortgage History
| Date | Status | Borrower | Loan Amount |
|---|---|---|---|
| Open | Cook John | $112,198 |
Source: Public Records
Tax History Compared to Growth
Tax History
| Year | Tax Paid | Tax Assessment Tax Assessment Total Assessment is a certain percentage of the fair market value that is determined by local assessors to be the total taxable value of land and additions on the property. | Land | Improvement |
|---|---|---|---|---|
| 2025 | $7,157 | $489,200 | $182,900 | $306,300 |
| 2024 | $6,773 | $472,000 | $165,700 | $306,300 |
| 2023 | $6,344 | $419,000 | $131,200 | $287,800 |
| 2022 | $5,690 | $331,800 | $117,300 | $214,500 |
| 2021 | $2,072 | $115,600 | $103,500 | $12,100 |
| 2020 | $2,544 | $149,800 | $103,500 | $46,300 |
| 2019 | $2,409 | $145,200 | $103,500 | $41,700 |
| 2018 | $2,380 | $145,200 | $103,500 | $41,700 |
| 2017 | $2,345 | $147,600 | $103,500 | $44,100 |
| 2016 | $2,420 | $146,400 | $103,500 | $42,900 |
| 2015 | $2,335 | $146,400 | $103,500 | $42,900 |
| 2014 | $2,377 | $149,900 | $107,000 | $42,900 |
Source: Public Records
Map
Nearby Homes
- 5 June St
- 452 River St
- 208 North St
- 46 Lowell Rd
- 23 Shawnee Rd Unit 23
- 38 Tarbell St Unit 5B
- 8 Jamie Rd
- 9 Tarbell St
- 28-30 Groton St
- 80A Nashua Rd
- 31 Prospect St
- 4 Parker Hill Way Unit C
- 10 Tucker St
- 139 Nashua Rd
- 38 River Rd Unit 11
- 147 Nashua Rd
- 170 Nashua Rd
- 24-A 34-A Dow St
- 319 Pleasant St
- 91 Chicopee Row