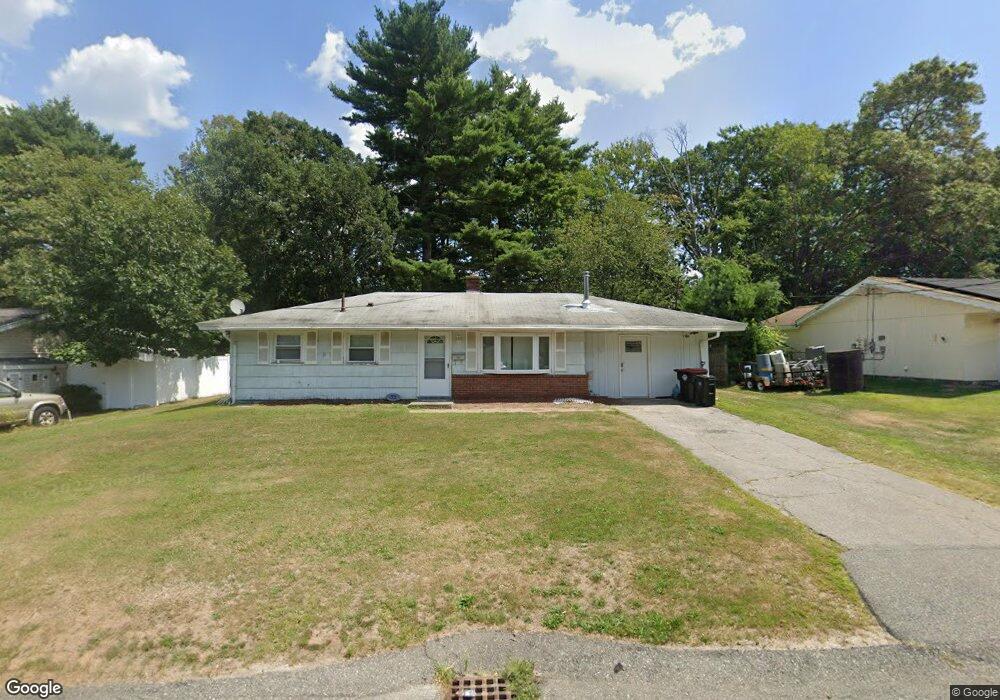
55 Elsie Rd Brockton, MA 02302
Montello NeighborhoodEstimated Value: $389,000 - $475,000
3
Beds
1
Bath
1,074
Sq Ft
$414/Sq Ft
Est. Value
About This Home
This home is located at 55 Elsie Rd, Brockton, MA 02302 and is currently estimated at $445,035, approximately $414 per square foot. 55 Elsie Rd is a home located in Plymouth County with nearby schools including Brookfield Elementary School, Mary E. Baker Elementary School, and Downey Elementary School.
Ownership History
Date
Name
Owned For
Owner Type
Purchase Details
Closed on
Apr 27, 2021
Sold by
Hall Jennifer and Morris Tommy
Bought by
Morris Tommy
Current Estimated Value
Purchase Details
Closed on
Feb 26, 2019
Sold by
Hall Joseph F and Hall Helena J
Bought by
Morris Tommy and Hall Jennifer
Home Financials for this Owner
Home Financials are based on the most recent Mortgage that was taken out on this home.
Original Mortgage
$228,000
Interest Rate
4.4%
Mortgage Type
New Conventional
Purchase Details
Closed on
Jun 17, 2008
Sold by
Hall Helena J and Horne Helena J
Bought by
Hall Helena J and Hall Joseph F
Home Financials for this Owner
Home Financials are based on the most recent Mortgage that was taken out on this home.
Original Mortgage
$189,957
Interest Rate
6.13%
Mortgage Type
Purchase Money Mortgage
Purchase Details
Closed on
Jul 7, 1995
Sold by
Milender Jay S and Hughes Janice L
Bought by
Horne Helena J
Purchase Details
Closed on
Jul 8, 1988
Sold by
Roback Christopher
Bought by
Milender Jay S
Purchase Details
Closed on
Jan 29, 1988
Sold by
Mcphall Robert J
Bought by
Roback Christopher
Create a Home Valuation Report for This Property
The Home Valuation Report is an in-depth analysis detailing your home's value as well as a comparison with similar homes in the area
Home Values in the Area
Average Home Value in this Area
Purchase History
| Date | Buyer | Sale Price | Title Company |
|---|---|---|---|
| Morris Tommy | -- | None Available | |
| Morris Tommy | -- | None Available | |
| Morris Tommy | $285,000 | -- | |
| Morris Tommy | $285,000 | -- | |
| Hall Helena J | -- | -- | |
| Hall Helena J | -- | -- | |
| Horne Helena J | $75,000 | -- | |
| Horne Helena J | $75,000 | -- | |
| Milender Jay S | $123,000 | -- | |
| Roback Christopher | $117,000 | -- |
Source: Public Records
Mortgage History
| Date | Status | Borrower | Loan Amount |
|---|---|---|---|
| Previous Owner | Morris Tommy | $228,000 | |
| Previous Owner | Roback Christopher | $189,957 |
Source: Public Records
Tax History Compared to Growth
Tax History
| Year | Tax Paid | Tax Assessment Tax Assessment Total Assessment is a certain percentage of the fair market value that is determined by local assessors to be the total taxable value of land and additions on the property. | Land | Improvement |
|---|---|---|---|---|
| 2025 | $4,383 | $361,900 | $160,600 | $201,300 |
| 2024 | $4,193 | $348,800 | $160,600 | $188,200 |
| 2023 | $4,269 | $328,900 | $110,900 | $218,000 |
| 2022 | $4,107 | $294,000 | $100,800 | $193,200 |
| 2021 | $3,814 | $263,000 | $93,800 | $169,200 |
| 2020 | $3,539 | $233,600 | $82,200 | $151,400 |
| 2019 | $3,517 | $226,300 | $78,600 | $147,700 |
| 2018 | $2,908 | $217,200 | $78,600 | $138,600 |
| 2017 | $2,908 | $180,600 | $78,600 | $102,000 |
| 2016 | $2,838 | $163,500 | $74,900 | $88,600 |
| 2015 | $2,679 | $147,600 | $74,900 | $72,700 |
| 2014 | $2,413 | $133,100 | $74,900 | $58,200 |
Source: Public Records
Map
Nearby Homes
- 285 Hovendon Ave
- 307 Regency Ln Unit 307
- 690 N Quincy St
- 53 Kent St
- 61 Kent St
- 421 Winter St
- 18 Brookfield Dr
- 505 Hampton Way Unit 505
- 261 Jon Dr
- 717 Hampton Way
- 21 Maplewood Cir
- 18 Dixon Rd
- 22 Blossom St
- 89 Dixon Rd
- 200 Sawtell Ave
- 176 Coe Rd
- 60 Bonney St
- 105 Oscar Ave
- 298 N Quincy St
- 5 Brookville Ave