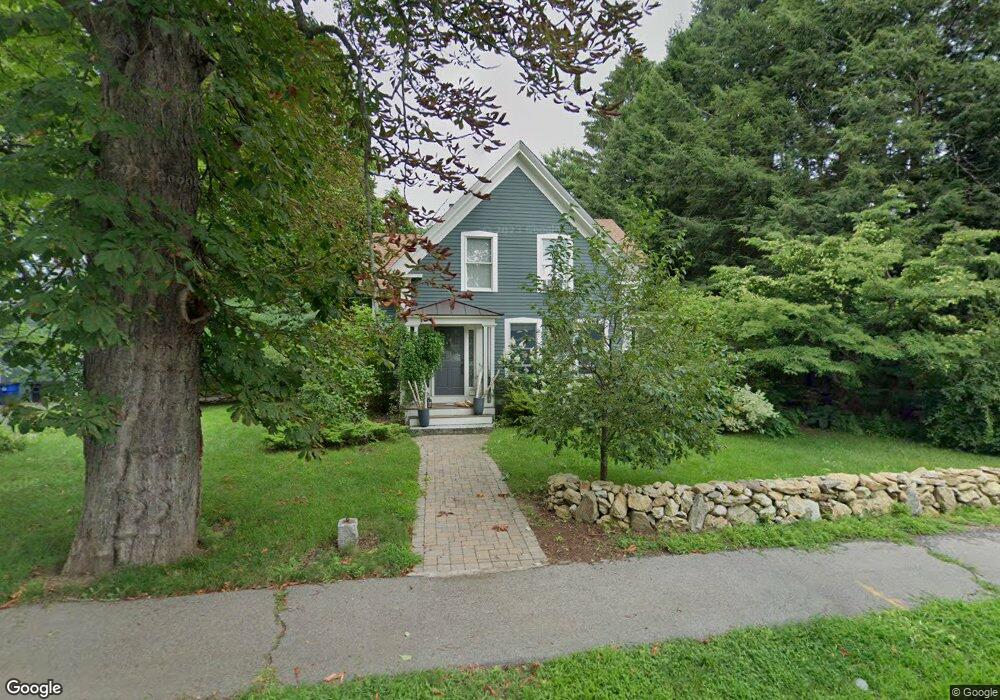
55 Fairhaven Rd Concord, MA 01742
Estimated Value: $2,000,000 - $2,217,000
5
Beds
4
Baths
3,492
Sq Ft
$598/Sq Ft
Est. Value
About This Home
This home is located at 55 Fairhaven Rd, Concord, MA 01742 and is currently estimated at $2,086,524, approximately $597 per square foot. 55 Fairhaven Rd is a home located in Middlesex County with nearby schools including Willard School, Concord Middle School, and The Fenn School.
Ownership History
Date
Name
Owned For
Owner Type
Purchase Details
Closed on
Aug 1, 2011
Sold by
Hardy Douglas S and Romberg Roselyn M
Bought by
Madan Neel and Dahlmann Kristen
Current Estimated Value
Home Financials for this Owner
Home Financials are based on the most recent Mortgage that was taken out on this home.
Original Mortgage
$750,000
Outstanding Balance
$505,282
Interest Rate
4%
Mortgage Type
Purchase Money Mortgage
Estimated Equity
$1,581,242
Purchase Details
Closed on
Apr 9, 1996
Sold by
Lapides Robert L and Lapides Judith A
Bought by
Rombert Roselyn M and Hardy Douglas S
Purchase Details
Closed on
Jan 3, 1990
Sold by
Mold James W
Bought by
Lapides Robert L
Create a Home Valuation Report for This Property
The Home Valuation Report is an in-depth analysis detailing your home's value as well as a comparison with similar homes in the area
Home Values in the Area
Average Home Value in this Area
Purchase History
| Date | Buyer | Sale Price | Title Company |
|---|---|---|---|
| Madan Neel | $967,000 | -- | |
| Rombert Roselyn M | $372,000 | -- | |
| Lapides Robert L | $345,000 | -- |
Source: Public Records
Mortgage History
| Date | Status | Borrower | Loan Amount |
|---|---|---|---|
| Open | Madan Neel | $750,000 | |
| Closed | Lapides Robert L | $120,300 | |
| Previous Owner | Lapides Robert L | $200,000 | |
| Previous Owner | Lapides Robert L | $200,000 |
Source: Public Records
Tax History Compared to Growth
Tax History
| Year | Tax Paid | Tax Assessment Tax Assessment Total Assessment is a certain percentage of the fair market value that is determined by local assessors to be the total taxable value of land and additions on the property. | Land | Improvement |
|---|---|---|---|---|
| 2025 | $240 | $1,811,800 | $630,100 | $1,181,700 |
| 2024 | $23,216 | $1,768,200 | $630,100 | $1,138,100 |
| 2023 | $19,633 | $1,514,900 | $572,900 | $942,000 |
| 2022 | $19,483 | $1,320,000 | $458,300 | $861,700 |
| 2021 | $18,346 | $1,246,300 | $458,300 | $788,000 |
| 2020 | $17,984 | $1,263,800 | $458,300 | $805,500 |
| 2019 | $17,339 | $1,221,900 | $444,900 | $777,000 |
| 2018 | $16,038 | $1,122,300 | $423,700 | $698,600 |
| 2017 | $15,905 | $1,130,400 | $403,500 | $726,900 |
| 2016 | $15,448 | $1,109,800 | $403,500 | $706,300 |
| 2015 | $14,460 | $1,011,900 | $373,700 | $638,200 |
Source: Public Records
Map
Nearby Homes
- 84 Bruce Rd
- 236 Fairhaven Rd
- 232 Sudbury Rd
- 143 Everett St
- 182 Southfield Rd
- 22 Belknap Ct
- 14 Thoreau St
- 46 Sudbury Rd
- 61B Walden St
- 106 Elm St
- 602 Main St
- 46 Wood St
- 38-40 Court Ln
- 49 Willard Common
- 497 Old Road to 9 Acre Corner
- 35 Chestnut St
- 29 Willard Common
- 37 Wolf Pine Way
- 140 Revolutionary Rd
- 96 Independence Rd