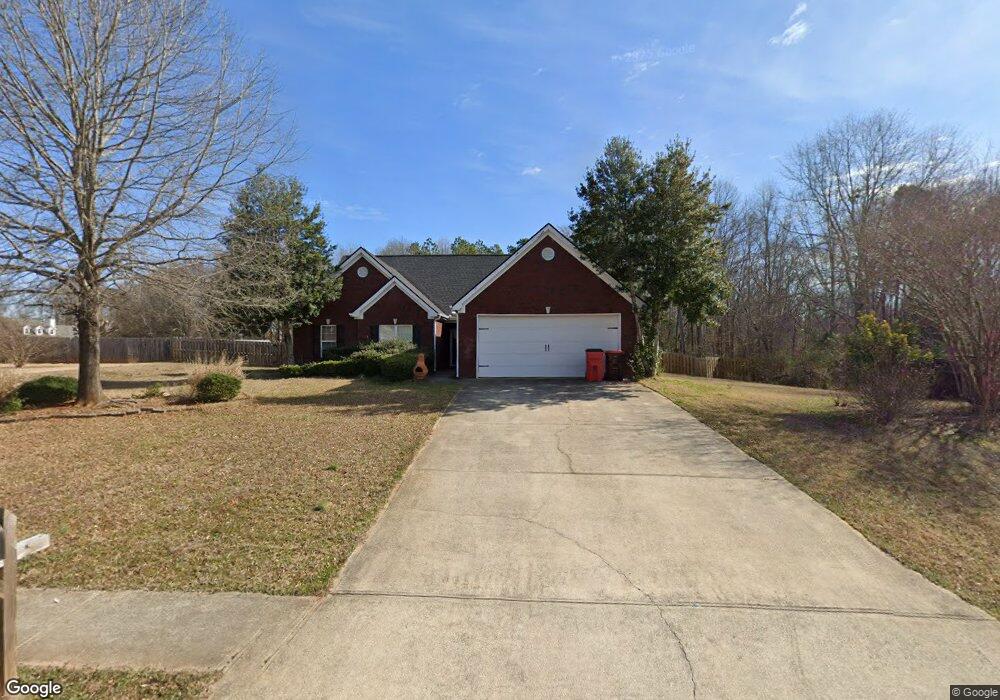
55 Feldspar Dr Jefferson, GA 30549
Estimated Value: $323,000 - $357,000
3
Beds
2
Baths
1,691
Sq Ft
$200/Sq Ft
Est. Value
About This Home
This home is located at 55 Feldspar Dr, Jefferson, GA 30549 and is currently estimated at $338,421, approximately $200 per square foot. 55 Feldspar Dr is a home located in Jackson County with nearby schools including South Jackson Elementary School, East Jackson Middle School, and East Jackson Comprehensive High School.
Ownership History
Date
Name
Owned For
Owner Type
Purchase Details
Closed on
Jun 28, 2010
Sold by
Moss Keri Riley
Bought by
Moss Keri Riley
Current Estimated Value
Home Financials for this Owner
Home Financials are based on the most recent Mortgage that was taken out on this home.
Original Mortgage
$137,645
Outstanding Balance
$93,508
Interest Rate
5.25%
Mortgage Type
FHA
Estimated Equity
$244,913
Purchase Details
Closed on
Jun 23, 2010
Sold by
Rodenroth Karen Cloud
Bought by
Riley Keri
Home Financials for this Owner
Home Financials are based on the most recent Mortgage that was taken out on this home.
Original Mortgage
$137,645
Outstanding Balance
$93,508
Interest Rate
5.25%
Mortgage Type
FHA
Estimated Equity
$244,913
Purchase Details
Closed on
Aug 30, 2007
Sold by
Not Provided
Bought by
Moss Keri Riley
Purchase Details
Closed on
May 30, 2006
Sold by
Not Provided
Bought by
Moss Keri Riley
Purchase Details
Closed on
May 6, 2006
Sold by
Btm Development Llc
Bought by
Brady Richard
Create a Home Valuation Report for This Property
The Home Valuation Report is an in-depth analysis detailing your home's value as well as a comparison with similar homes in the area
Home Values in the Area
Average Home Value in this Area
Purchase History
| Date | Buyer | Sale Price | Title Company |
|---|---|---|---|
| Moss Keri Riley | -- | -- | |
| Riley Keri | $139,500 | -- | |
| Moss Keri Riley | -- | -- | |
| Moss Keri Riley | $158,000 | -- | |
| Brady Richard | -- | -- |
Source: Public Records
Mortgage History
| Date | Status | Borrower | Loan Amount |
|---|---|---|---|
| Open | Riley Keri | $137,645 |
Source: Public Records
Tax History Compared to Growth
Tax History
| Year | Tax Paid | Tax Assessment Tax Assessment Total Assessment is a certain percentage of the fair market value that is determined by local assessors to be the total taxable value of land and additions on the property. | Land | Improvement |
|---|---|---|---|---|
| 2024 | $2,479 | $96,960 | $12,880 | $84,080 |
| 2023 | $2,479 | $87,880 | $12,880 | $75,000 |
| 2022 | $2,061 | $73,600 | $12,880 | $60,720 |
| 2021 | $2,076 | $73,600 | $12,880 | $60,720 |
| 2020 | $1,937 | $62,960 | $12,880 | $50,080 |
| 2019 | $1,966 | $62,960 | $12,880 | $50,080 |
| 2018 | $1,913 | $60,480 | $12,880 | $47,600 |
| 2017 | $1,808 | $56,815 | $12,880 | $43,935 |
| 2016 | $1,818 | $56,815 | $12,880 | $43,935 |
| 2015 | $1,664 | $51,935 | $8,000 | $43,935 |
| 2014 | $1,629 | $50,515 | $8,000 | $42,515 |
| 2013 | -- | $50,090 | $8,000 | $42,090 |
Source: Public Records
Map
Nearby Homes
- 70 Feldspar Dr
- 385 Feldspar Dr
- 1094 B Whitfield Rd
- 582 B Whitfield Rd
- 0 Berch Tree Trail Unit LOT 12
- 0 Berch Tree Trail Unit LOT 7
- 261 Petal Creek Ln
- 126 Old Indian Trail
- 4 W Farm Rd
- 2200 Lebanon Church Lot 3 Rd
- 2200 BLOCK Lebanon Church Rd Unit LOT 3
- 0 Lebanon Church Rd Unit 180224
- 0 Lebanon Church Rd Unit 254186
- 0 Lebanon Church Rd Unit 10532406
- 6392 Athens Hwy
- 0 Harrison Johnson Way Unit 10529233
- 3845 S Highway 82
- 808 Rock Forge Rd
- 37 Carruth Rd
- 55 Feldspar Dr Unit 2
- 75 Feldspar Dr
- LOT5 Feldspar Dr
- 27 Feldspar Dr
- 24 Feldspar Dr Unit 2
- 24 Feldspar Dr
- 36 Feldspar Dr
- 37 Feldspar Dr
- 26 Feldspar Dr
- 35 Feldspar Dr
- 3 Feldspar Dr
- 4 Feldspar Dr
- 76 Feldspar Dr
- 88 Feldspar Dr
- 99 Feldspar Dr Unit 49
- 99 Feldspar Dr
- 92 Feldspar Dr
- 268 Redstone Rd
- 244 Redstone Rd
- 292 Redstone Rd Unit 2