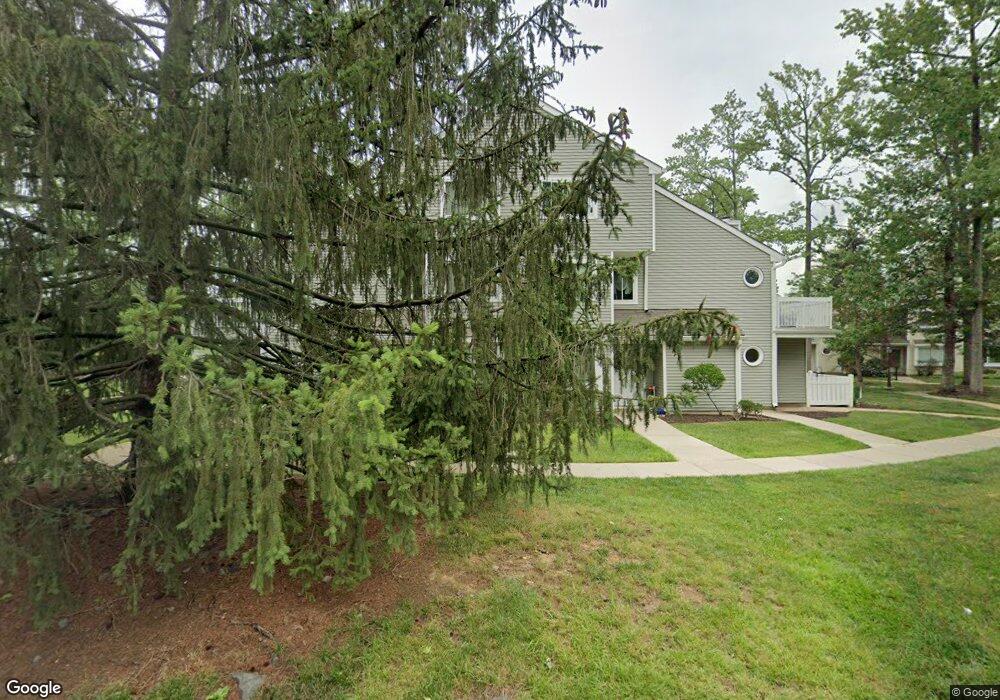
55 Foxtail Ln Monmouth Junction, NJ 08852
Estimated Value: $310,985 - $363,000
--
Bed
--
Bath
1,216
Sq Ft
$283/Sq Ft
Est. Value
About This Home
This home is located at 55 Foxtail Ln, Monmouth Junction, NJ 08852 and is currently estimated at $343,996, approximately $282 per square foot. 55 Foxtail Ln is a home located in Middlesex County with nearby schools including Constable Elementary School, Crossroads North Middle School, and South Brunswick High School.
Ownership History
Date
Name
Owned For
Owner Type
Purchase Details
Closed on
Nov 20, 2003
Sold by
Kairon Tirath
Bought by
Hu Zongqi and Wang Yumie
Current Estimated Value
Home Financials for this Owner
Home Financials are based on the most recent Mortgage that was taken out on this home.
Original Mortgage
$123,200
Interest Rate
5.82%
Purchase Details
Closed on
Sep 6, 2002
Sold by
Jt Richard Consultants
Bought by
Kairon Tirath
Home Financials for this Owner
Home Financials are based on the most recent Mortgage that was taken out on this home.
Original Mortgage
$144,000
Interest Rate
6.2%
Create a Home Valuation Report for This Property
The Home Valuation Report is an in-depth analysis detailing your home's value as well as a comparison with similar homes in the area
Home Values in the Area
Average Home Value in this Area
Purchase History
| Date | Buyer | Sale Price | Title Company |
|---|---|---|---|
| Hu Zongqi | $176,000 | -- | |
| Kairon Tirath | $160,000 | -- |
Source: Public Records
Mortgage History
| Date | Status | Borrower | Loan Amount |
|---|---|---|---|
| Previous Owner | Hu Zongqi | $123,200 | |
| Previous Owner | Kairon Tirath | $144,000 |
Source: Public Records
Tax History Compared to Growth
Tax History
| Year | Tax Paid | Tax Assessment Tax Assessment Total Assessment is a certain percentage of the fair market value that is determined by local assessors to be the total taxable value of land and additions on the property. | Land | Improvement |
|---|---|---|---|---|
| 2025 | $4,275 | $78,500 | $42,000 | $36,500 |
| 2024 | $4,121 | $78,500 | $42,000 | $36,500 |
| 2023 | $4,121 | $78,500 | $42,000 | $36,500 |
| 2022 | $4,000 | $78,500 | $42,000 | $36,500 |
| 2021 | $3,077 | $78,500 | $42,000 | $36,500 |
| 2020 | $4,022 | $78,500 | $42,000 | $36,500 |
| 2019 | $4,058 | $78,500 | $42,000 | $36,500 |
| 2018 | $3,925 | $78,500 | $42,000 | $36,500 |
| 2017 | $3,919 | $78,500 | $42,000 | $36,500 |
| 2016 | $3,877 | $78,500 | $42,000 | $36,500 |
| 2015 | $3,759 | $78,500 | $42,000 | $36,500 |
| 2014 | $3,699 | $78,500 | $42,000 | $36,500 |
Source: Public Records
Map
Nearby Homes