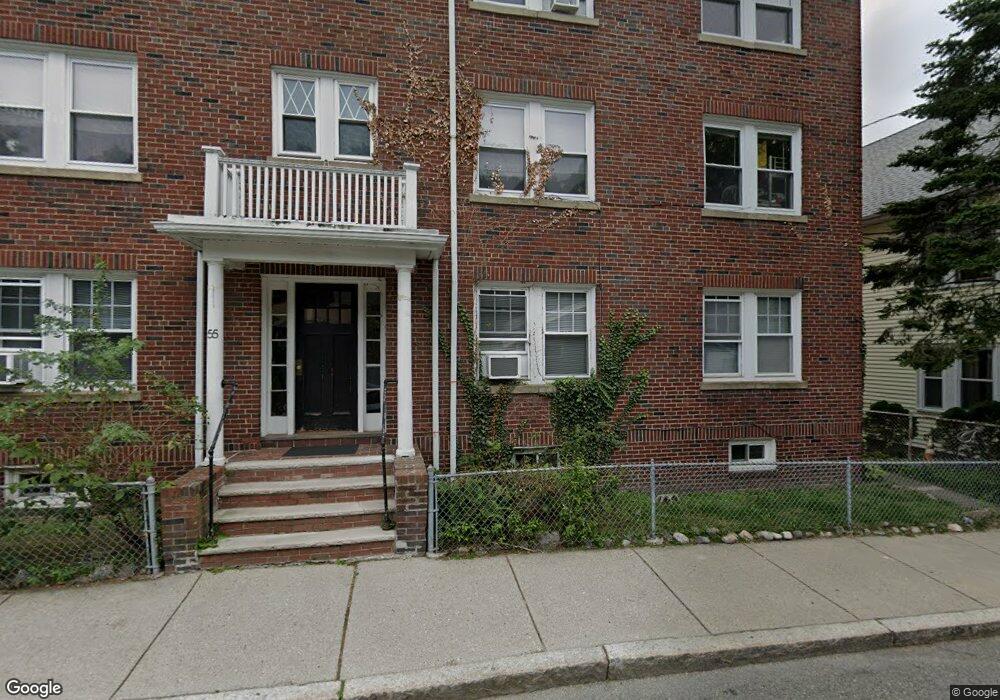
55 Franklin St Brookline, MA 02445
Brookline Village NeighborhoodEstimated Value: $2,303,000 - $2,628,000
9
Beds
3
Baths
4,512
Sq Ft
$537/Sq Ft
Est. Value
About This Home
This home is located at 55 Franklin St, Brookline, MA 02445 and is currently estimated at $2,422,667, approximately $536 per square foot. 55 Franklin St is a home located in Norfolk County with nearby schools including William H. Lincoln School, Maimonides School, and St. Mary of the Assumption Elementary School.
Ownership History
Date
Name
Owned For
Owner Type
Purchase Details
Closed on
Oct 10, 2013
Sold by
Hall Amy H and Hingston Joseph D
Bought by
Omalley Margaret R and Fay Cheryl A
Current Estimated Value
Home Financials for this Owner
Home Financials are based on the most recent Mortgage that was taken out on this home.
Original Mortgage
$1
Outstanding Balance
$1
Interest Rate
4.53%
Purchase Details
Closed on
Dec 29, 2006
Sold by
55 Franklin Nt
Bought by
Hingston Ft
Create a Home Valuation Report for This Property
The Home Valuation Report is an in-depth analysis detailing your home's value as well as a comparison with similar homes in the area
Home Values in the Area
Average Home Value in this Area
Purchase History
| Date | Buyer | Sale Price | Title Company |
|---|---|---|---|
| Omalley Margaret R | -- | -- | |
| Omalley Margaret R | -- | -- | |
| Hingston Ft | -- | -- |
Source: Public Records
Mortgage History
| Date | Status | Borrower | Loan Amount |
|---|---|---|---|
| Open | Omalley Margaret R | $1 | |
| Closed | Omalley Margaret R | $1 |
Source: Public Records
Tax History Compared to Growth
Tax History
| Year | Tax Paid | Tax Assessment Tax Assessment Total Assessment is a certain percentage of the fair market value that is determined by local assessors to be the total taxable value of land and additions on the property. | Land | Improvement |
|---|---|---|---|---|
| 2025 | $21,406 | $2,168,800 | $680,300 | $1,488,500 |
| 2024 | $21,765 | $2,227,700 | $654,100 | $1,573,600 |
| 2023 | $20,353 | $2,041,400 | $567,300 | $1,474,100 |
| 2022 | $19,811 | $1,944,200 | $540,300 | $1,403,900 |
| 2021 | $18,320 | $1,869,400 | $519,500 | $1,349,900 |
| 2020 | $17,519 | $1,853,900 | $472,300 | $1,381,600 |
| 2019 | $16,544 | $1,765,600 | $449,800 | $1,315,800 |
| 2018 | $15,735 | $1,663,300 | $388,200 | $1,275,100 |
| 2017 | $15,216 | $1,540,100 | $366,300 | $1,173,800 |
| 2016 | $14,589 | $1,400,100 | $342,300 | $1,057,800 |
| 2015 | $11,097 | $1,039,000 | $319,900 | $719,100 |
| 2014 | $11,212 | $984,400 | $290,900 | $693,500 |
Source: Public Records
Map
Nearby Homes
- 20 Rice St Unit 2
- 105 Franklin St Unit 1
- 18 Chestnut Place
- 81 Glen Rd Unit S2
- 60 Glen Rd Unit 101
- 18 Cushing Rd
- 241 Perkins St Unit C306
- 241 Perkins St Unit C402
- 241 Perkins St Unit D405
- 36 Allerton St
- 21 Sargent Crossway
- 99 Pond Ave Unit 608
- 371 Walnut St
- 72 Cypress St Unit 1
- 111 Perkins St Unit 108
- 111 Perkins St Unit 282
- 111 Perkins St Unit 121
- 111 Perkins St Unit 152
- 6 Juniper St Unit 16
- 77 Pond Ave Unit 1103
- 55 Franklin St Unit 3,55
- 55 Franklin St Unit 2
- 55 Franklin St Unit 1
- 55 Franklin St Unit 3
- 51 Franklin St Unit 53
- 20 Hart St
- 61 Franklin St
- 18 Hart St
- 60 Franklin St
- 23 Roberts St
- 23 Roberts St Unit 2
- 23 Roberts St Unit 1
- 63 Franklin St
- 19 Roberts St Unit 1
- 19 Roberts St
- 19 Roberts St Unit 8
- 19 Roberts St Unit 4
- 19 Roberts St Unit 19,2
- 19 Roberts St Unit 2/3
- 19 Roberts St