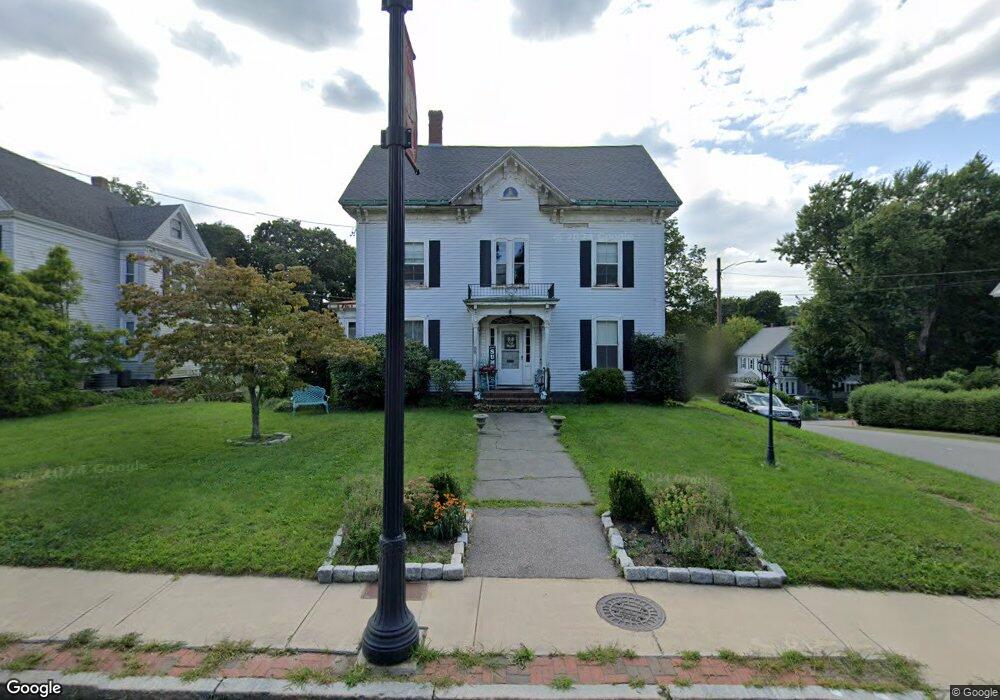
55 Front St Weymouth, MA 02188
Weymouth Landing NeighborhoodEstimated Value: $729,600 - $821,000
5
Beds
3
Baths
3,552
Sq Ft
$219/Sq Ft
Est. Value
About This Home
This home is located at 55 Front St, Weymouth, MA 02188 and is currently estimated at $779,400, approximately $219 per square foot. 55 Front St is a home located in Norfolk County with nearby schools including Frederick C Murphy, Abigail Adams Middle School, and Weymouth Middle School Chapman.
Ownership History
Date
Name
Owned For
Owner Type
Purchase Details
Closed on
Aug 20, 1999
Sold by
Mullen Tr Janice L
Bought by
Guerard Patrick S and Guerard Heather A
Current Estimated Value
Home Financials for this Owner
Home Financials are based on the most recent Mortgage that was taken out on this home.
Original Mortgage
$155,000
Outstanding Balance
$44,368
Interest Rate
7.6%
Mortgage Type
Purchase Money Mortgage
Estimated Equity
$735,032
Create a Home Valuation Report for This Property
The Home Valuation Report is an in-depth analysis detailing your home's value as well as a comparison with similar homes in the area
Home Values in the Area
Average Home Value in this Area
Purchase History
| Date | Buyer | Sale Price | Title Company |
|---|---|---|---|
| Guerard Patrick S | $225,000 | -- |
Source: Public Records
Mortgage History
| Date | Status | Borrower | Loan Amount |
|---|---|---|---|
| Open | Guerard Patrick S | $155,000 |
Source: Public Records
Tax History
| Year | Tax Paid | Tax Assessment Tax Assessment Total Assessment is a certain percentage of the fair market value that is determined by local assessors to be the total taxable value of land and additions on the property. | Land | Improvement |
|---|---|---|---|---|
| 2025 | $6,799 | $673,200 | $204,900 | $468,300 |
| 2024 | $6,586 | $641,300 | $195,200 | $446,100 |
| 2023 | $6,379 | $610,400 | $180,700 | $429,700 |
| 2022 | $6,167 | $538,100 | $167,300 | $370,800 |
| 2021 | $6,025 | $513,200 | $167,300 | $345,900 |
| 2020 | $5,881 | $493,400 | $167,300 | $326,100 |
| 2019 | $5,734 | $473,100 | $160,900 | $312,200 |
| 2018 | $5,533 | $442,600 | $153,200 | $289,400 |
| 2017 | $5,070 | $395,800 | $146,000 | $249,800 |
| 2016 | $4,929 | $385,100 | $140,400 | $244,700 |
| 2015 | $4,737 | $367,200 | $140,400 | $226,800 |
| 2014 | $4,583 | $344,600 | $130,600 | $214,000 |
Source: Public Records
Map
Nearby Homes
- 122 Washington St Unit Twenty-two
- 11 Richmond St
- 15 Summer St
- 25 Richmond St
- 37 Lantern Ln
- 41 Lantern Ln
- 19 Vine St Unit 3
- 19 Vine St Unit 2
- 107 Summer St
- 46 Roosevelt Rd
- 33 Congress St
- 54 Edgemont Rd
- 16 Beechwood Rd
- 300 Commercial St Unit 23
- 82 Lester Ln
- 26 Tingley Rd
- 211 Roosevelt Rd
- 312 Shaw St
- 31 Doris Rd
- 70 Biscayne Ave
Your Personal Tour Guide
Ask me questions while you tour the home.