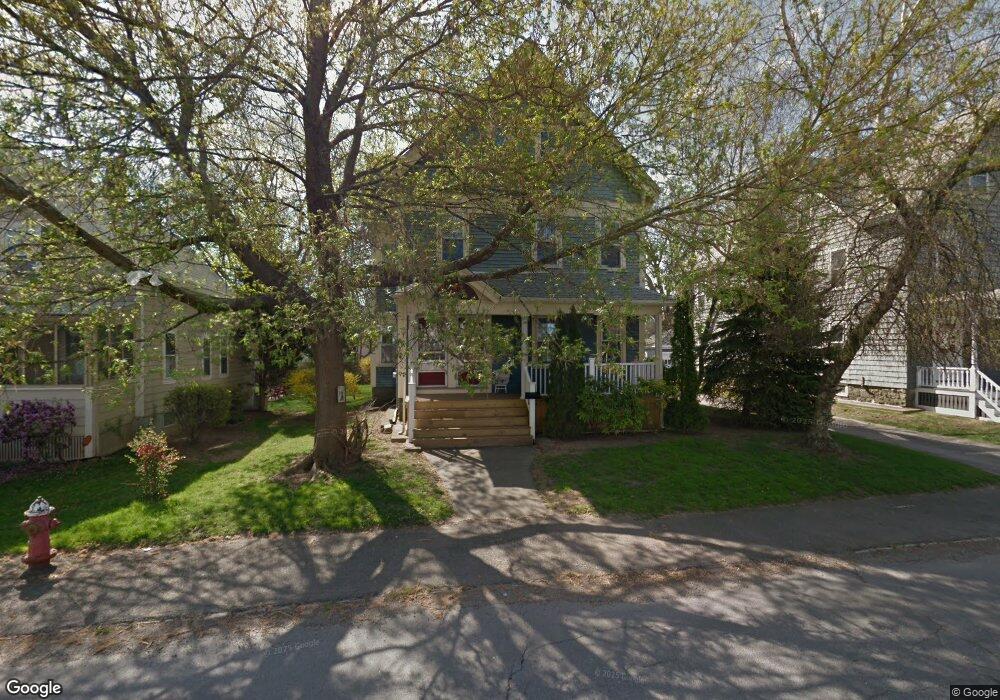
55 Grant St Unit 1 Taunton, MA 02780
City Center NeighborhoodEstimated Value: $639,000 - $731,000
3
Beds
1
Bath
1,400
Sq Ft
$492/Sq Ft
Est. Value
About This Home
This home is located at 55 Grant St Unit 1, Taunton, MA 02780 and is currently estimated at $689,315, approximately $492 per square foot. 55 Grant St Unit 1 is a home located in Bristol County with nearby schools including Elizabeth Pole School, Taunton High School, and John F. Parker Middle School.
Ownership History
Date
Name
Owned For
Owner Type
Purchase Details
Closed on
Jul 29, 2015
Sold by
Okeefe Dennis J
Bought by
Dinublia Frank J and Hawko Rhea
Current Estimated Value
Home Financials for this Owner
Home Financials are based on the most recent Mortgage that was taken out on this home.
Original Mortgage
$259,218
Outstanding Balance
$201,912
Interest Rate
3.75%
Mortgage Type
FHA
Estimated Equity
$487,403
Purchase Details
Closed on
Apr 30, 2013
Sold by
Moran Patricia L
Bought by
Okeefe Dennis J
Home Financials for this Owner
Home Financials are based on the most recent Mortgage that was taken out on this home.
Original Mortgage
$153,750
Interest Rate
3.64%
Mortgage Type
New Conventional
Purchase Details
Closed on
Sep 20, 2006
Sold by
Moran James F and Moran Patricia L
Bought by
Moran Patricia L
Create a Home Valuation Report for This Property
The Home Valuation Report is an in-depth analysis detailing your home's value as well as a comparison with similar homes in the area
Home Values in the Area
Average Home Value in this Area
Purchase History
| Date | Buyer | Sale Price | Title Company |
|---|---|---|---|
| Dinublia Frank J | $264,000 | -- | |
| Okeefe Dennis J | $205,000 | -- | |
| Okeefe Dennis J | $205,000 | -- | |
| Moran Patricia L | -- | -- |
Source: Public Records
Mortgage History
| Date | Status | Borrower | Loan Amount |
|---|---|---|---|
| Open | Dinublia Frank J | $259,218 | |
| Previous Owner | Okeefe Dennis J | $153,750 |
Source: Public Records
Tax History Compared to Growth
Tax History
| Year | Tax Paid | Tax Assessment Tax Assessment Total Assessment is a certain percentage of the fair market value that is determined by local assessors to be the total taxable value of land and additions on the property. | Land | Improvement |
|---|---|---|---|---|
| 2025 | $7,228 | $660,700 | $108,200 | $552,500 |
| 2024 | $6,940 | $620,200 | $108,200 | $512,000 |
| 2023 | $6,479 | $537,700 | $113,100 | $424,600 |
| 2022 | $5,775 | $438,200 | $87,700 | $350,500 |
| 2021 | $5,622 | $395,900 | $79,800 | $316,100 |
| 2020 | $5,451 | $366,800 | $79,800 | $287,000 |
| 2019 | $4,903 | $311,100 | $79,800 | $231,300 |
| 2018 | $4,683 | $297,900 | $79,800 | $218,100 |
| 2017 | $4,325 | $275,300 | $75,700 | $199,600 |
| 2016 | $3,495 | $222,900 | $73,500 | $149,400 |
| 2015 | $3,149 | $209,800 | $73,700 | $136,100 |
| 2014 | $3,051 | $208,800 | $71,500 | $137,300 |
Source: Public Records
Map
Nearby Homes