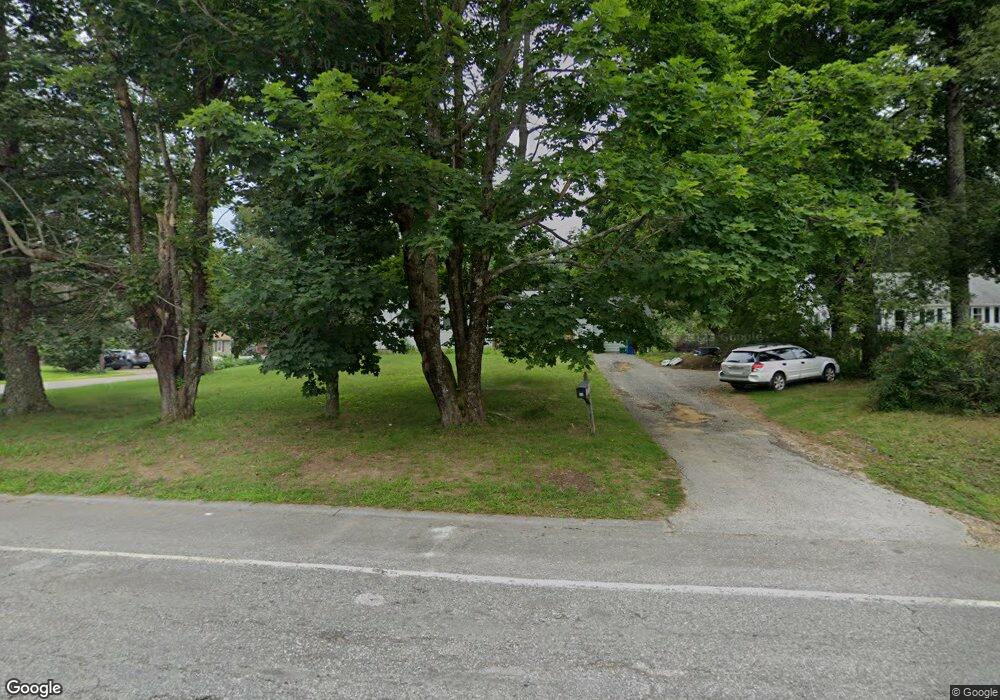
55 Grove St Paxton, MA 01612
Estimated Value: $407,000 - $521,000
3
Beds
1
Bath
2,000
Sq Ft
$225/Sq Ft
Est. Value
About This Home
This home is located at 55 Grove St, Paxton, MA 01612 and is currently estimated at $450,656, approximately $225 per square foot. 55 Grove St is a home located in Worcester County with nearby schools including Wachusett Regional High School, Holden Christian Academy, and Worcester Seventh-Day Adventist School.
Ownership History
Date
Name
Owned For
Owner Type
Purchase Details
Closed on
Jul 31, 2009
Sold by
Lussier Gail M
Bought by
Salls Brandi
Current Estimated Value
Home Financials for this Owner
Home Financials are based on the most recent Mortgage that was taken out on this home.
Original Mortgage
$191,468
Outstanding Balance
$126,232
Interest Rate
5.43%
Mortgage Type
Purchase Money Mortgage
Estimated Equity
$324,424
Purchase Details
Closed on
Jun 9, 2008
Sold by
Lussier Gail M and Carlino Susan E
Bought by
Lussier Gail M
Purchase Details
Closed on
Mar 1, 2006
Sold by
Johnson Karen J and Gamache Kenneth A
Bought by
Lussier Gail M and Carlino Susan E
Home Financials for this Owner
Home Financials are based on the most recent Mortgage that was taken out on this home.
Original Mortgage
$189,600
Interest Rate
6.16%
Mortgage Type
Purchase Money Mortgage
Purchase Details
Closed on
Sep 30, 2003
Sold by
Bradley Cheryl M and Johnson Karen J
Bought by
Johnson Karen J and Gamanche Kenneth A
Create a Home Valuation Report for This Property
The Home Valuation Report is an in-depth analysis detailing your home's value as well as a comparison with similar homes in the area
Home Values in the Area
Average Home Value in this Area
Purchase History
| Date | Buyer | Sale Price | Title Company |
|---|---|---|---|
| Salls Brandi | $195,000 | -- | |
| Lussier Gail M | -- | -- | |
| Lussier Gail M | $237,000 | -- | |
| Johnson Karen J | -- | -- |
Source: Public Records
Mortgage History
| Date | Status | Borrower | Loan Amount |
|---|---|---|---|
| Open | Salls Brandi | $191,468 | |
| Previous Owner | Lussier Gail M | $189,600 |
Source: Public Records
Tax History Compared to Growth
Tax History
| Year | Tax Paid | Tax Assessment Tax Assessment Total Assessment is a certain percentage of the fair market value that is determined by local assessors to be the total taxable value of land and additions on the property. | Land | Improvement |
|---|---|---|---|---|
| 2025 | $5,296 | $359,300 | $104,300 | $255,000 |
| 2024 | $5,462 | $339,900 | $104,300 | $235,600 |
| 2023 | $5,492 | $312,400 | $94,900 | $217,500 |
| 2022 | $5,309 | $279,700 | $94,900 | $184,800 |
| 2021 | $6,588 | $254,700 | $86,500 | $168,200 |
| 2020 | $4,869 | $246,800 | $78,600 | $168,200 |
| 2019 | $4,730 | $239,600 | $71,400 | $168,200 |
| 2018 | $4,305 | $210,700 | $68,000 | $142,700 |
| 2017 | $4,039 | $198,100 | $64,700 | $133,400 |
| 2016 | $3,813 | $185,200 | $64,700 | $120,500 |
| 2015 | $3,601 | $173,200 | $64,700 | $108,500 |
| 2014 | $3,499 | $170,600 | $64,700 | $105,900 |
Source: Public Records
Map
Nearby Homes