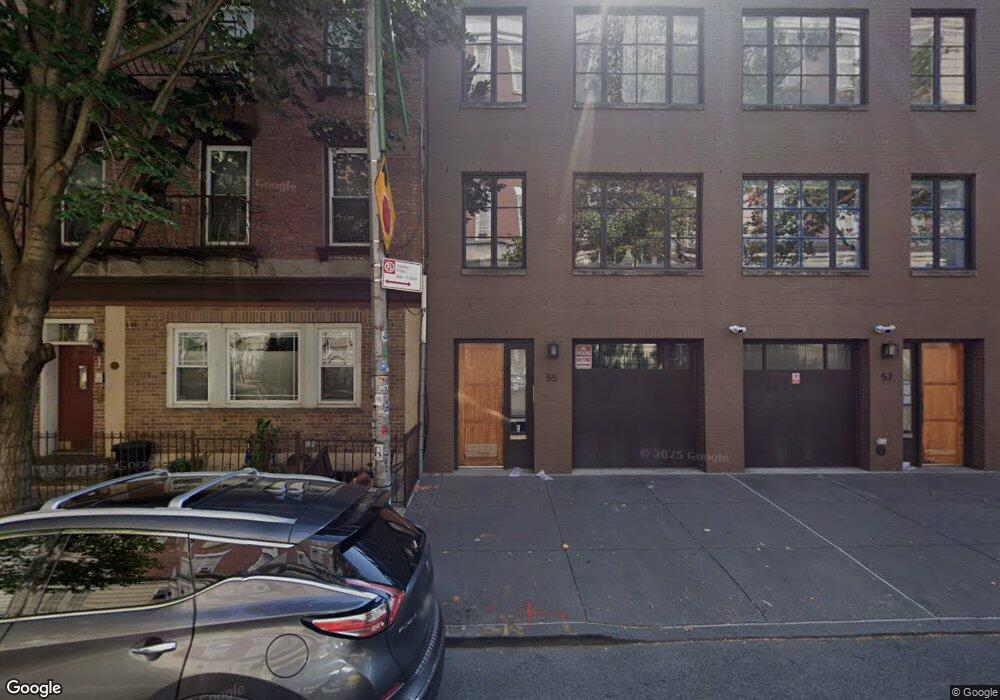
55 Havemeyer St Unit 57 Brooklyn, NY 11211
Williamsburg NeighborhoodEstimated Value: $1,399,932 - $4,065,000
--
Bed
--
Bath
3,555
Sq Ft
$889/Sq Ft
Est. Value
About This Home
This home is located at 55 Havemeyer St Unit 57, Brooklyn, NY 11211 and is currently estimated at $3,160,983, approximately $889 per square foot. 55 Havemeyer St Unit 57 is a home located in Kings County with nearby schools including P.S. 17 Henry D Woodworth, Success Academy Charter School-NYC 9, and MESA Charter High School.
Ownership History
Date
Name
Owned For
Owner Type
Purchase Details
Closed on
Jun 10, 2024
Sold by
Camilleri Michael
Bought by
Caillon Living Trust Dated September 28 and Pascal Caillon As Trustee
Current Estimated Value
Home Financials for this Owner
Home Financials are based on the most recent Mortgage that was taken out on this home.
Original Mortgage
$2,400,000
Outstanding Balance
$2,370,527
Interest Rate
7.22%
Mortgage Type
Purchase Money Mortgage
Estimated Equity
$790,456
Purchase Details
Closed on
Feb 12, 2016
Sold by
Yang Peter Bing
Bought by
Camilleri Michael
Purchase Details
Closed on
Jan 28, 2011
Sold by
He Havemeyer Llc and Lh Havemeyer Llc
Bought by
Yang Peter Bing
Home Financials for this Owner
Home Financials are based on the most recent Mortgage that was taken out on this home.
Original Mortgage
$1,067,500
Interest Rate
5.04%
Mortgage Type
Purchase Money Mortgage
Create a Home Valuation Report for This Property
The Home Valuation Report is an in-depth analysis detailing your home's value as well as a comparison with similar homes in the area
Home Values in the Area
Average Home Value in this Area
Purchase History
| Date | Buyer | Sale Price | Title Company |
|---|---|---|---|
| Caillon Living Trust Dated September 28 | $3,650,000 | -- | |
| Camilleri Michael | $3,700,000 | -- | |
| Camilleri Michael | $3,700,000 | -- | |
| Yang Peter Bing | $1,552,831 | -- | |
| Yang Peter Bing | $1,552,831 | -- |
Source: Public Records
Mortgage History
| Date | Status | Borrower | Loan Amount |
|---|---|---|---|
| Open | Caillon Living Trust Dated September 28 | $2,400,000 | |
| Previous Owner | Yang Peter Bing | $1,067,500 |
Source: Public Records
Tax History Compared to Growth
Tax History
| Year | Tax Paid | Tax Assessment Tax Assessment Total Assessment is a certain percentage of the fair market value that is determined by local assessors to be the total taxable value of land and additions on the property. | Land | Improvement |
|---|---|---|---|---|
| 2025 | $4,511 | $100,825 | $7,947 | $92,878 |
| 2024 | $4,511 | $83,963 | $7,947 | $76,016 |
| 2023 | $4,289 | $69,969 | $7,947 | $62,022 |
| 2022 | $3,960 | $68,723 | $7,947 | $60,776 |
| 2021 | $3,677 | $55,056 | $7,947 | $47,109 |
| 2020 | $1,674 | $53,451 | $7,947 | $45,504 |
| 2019 | $3,500 | $44,506 | $7,947 | $36,559 |
| 2018 | $3,420 | $26,892 | $5,762 | $21,130 |
| 2017 | $3,167 | $24,900 | $6,194 | $18,706 |
| 2016 | $2,972 | $23,056 | $7,170 | $15,886 |
| 2015 | $1,888 | $21,349 | $7,947 | $13,402 |
| 2014 | $1,888 | $21,349 | $7,947 | $13,402 |
Source: Public Records
Map
Nearby Homes
- 308 N 7th St Unit 5A
- 100 Roebling St
- 260 N 9th St Unit 4A
- 260 N 9th St Unit 7A
- 236 N 7th St Unit 4L
- 224 N 6th St Unit 2
- 224 N 6th St Unit 3
- 207 N 5th St Unit GARDEN
- 526 Union Ave Unit 508
- 526 Union Ave Unit 303
- 25 Conselyea St Unit 1
- 30 Skillman Ave Unit 2-R
- 30 Skillman Ave Unit 3-R
- 30 Skillman Ave Unit 2-F
- 30 Skillman Ave Unit 4-F
- 30 Skillman Ave Unit 3-F
- 147 Hope St Unit 3F
- 147 Hope St Unit 3A
- 147 Hope St Unit 5C
- 550 Metropolitan Ave Unit COMMERCIAL
- 55 Havemeyer St Unit TH55
- 55 Havemeyer St
- 55 Havemeyer St Unit 59
- 57 Havemeyer St Unit TWNH
- 57 Havemeyer St Unit Building
- 57 Havemeyer St
- 59 Havemeyer St Unit TH
- 59 Havemeyer St
- 53 Havemeyer St
- 263 N 6th St
- 265 N 6 Th St
- 265 N 6th St
- 265 N 6th St Unit Building
- 267 N 6th St
- 267 N 6th St Unit 2-E
- 267 N 6th St Unit 7-G
- 267 N 6th St Unit 5-E
- 267 N 6th St Unit 3
- 267 N 6th St Unit 8-E
- 267 N 6th St Unit 10-E