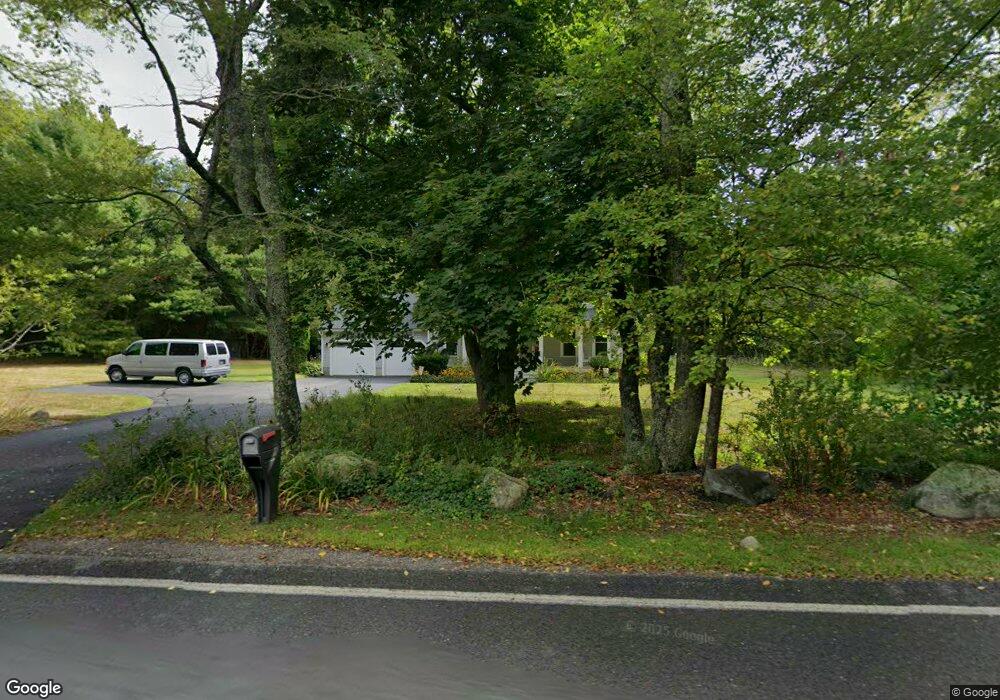
55 High St Carver, MA 02330
Estimated Value: $695,000 - $844,000
4
Beds
3
Baths
2,016
Sq Ft
$386/Sq Ft
Est. Value
About This Home
This home is located at 55 High St, Carver, MA 02330 and is currently estimated at $777,927, approximately $385 per square foot. 55 High St is a home located in Plymouth County with nearby schools including Carver Elementary School and Carver Middle/High School.
Ownership History
Date
Name
Owned For
Owner Type
Purchase Details
Closed on
Jul 17, 2025
Sold by
Wood Cynthia A
Bought by
55 High St Nt and Wood
Current Estimated Value
Purchase Details
Closed on
Aug 16, 2001
Sold by
Herman John P and Herman Andrea M
Bought by
Wood Cynthia A and Driscoll Gregory J
Home Financials for this Owner
Home Financials are based on the most recent Mortgage that was taken out on this home.
Original Mortgage
$334,400
Interest Rate
7.16%
Mortgage Type
Purchase Money Mortgage
Create a Home Valuation Report for This Property
The Home Valuation Report is an in-depth analysis detailing your home's value as well as a comparison with similar homes in the area
Home Values in the Area
Average Home Value in this Area
Purchase History
| Date | Buyer | Sale Price | Title Company |
|---|---|---|---|
| 55 High St Nt | -- | -- | |
| 55 High St Nt | -- | -- | |
| Wood Cynthia A | $352,000 | -- | |
| Wood Cynthia A | $352,000 | -- |
Source: Public Records
Mortgage History
| Date | Status | Borrower | Loan Amount |
|---|---|---|---|
| Previous Owner | Wood Cynthia A | $213,000 | |
| Previous Owner | Wood Cynthia A | $322,700 | |
| Previous Owner | Wood Cynthia A | $20,000 | |
| Previous Owner | Wood Cynthia A | $334,400 |
Source: Public Records
Tax History
| Year | Tax Paid | Tax Assessment Tax Assessment Total Assessment is a certain percentage of the fair market value that is determined by local assessors to be the total taxable value of land and additions on the property. | Land | Improvement |
|---|---|---|---|---|
| 2025 | $8,756 | $631,300 | $170,100 | $461,200 |
| 2024 | $8,241 | $581,600 | $166,700 | $414,900 |
| 2023 | $7,930 | $543,500 | $166,700 | $376,800 |
| 2022 | $7,432 | $465,100 | $142,600 | $322,500 |
| 2021 | $7,360 | $434,500 | $127,400 | $307,100 |
| 2020 | $7,014 | $408,000 | $119,000 | $289,000 |
| 2019 | $6,823 | $400,200 | $115,500 | $284,700 |
| 2018 | $6,560 | $372,100 | $115,500 | $256,600 |
| 2017 | $6,331 | $357,900 | $111,200 | $246,700 |
| 2016 | $5,828 | $342,200 | $105,900 | $236,300 |
| 2015 | $5,567 | $327,300 | $105,900 | $221,400 |
| 2014 | $5,411 | $318,100 | $133,800 | $184,300 |
Source: Public Records
Map
Nearby Homes
Your Personal Tour Guide
Ask me questions while you tour the home.