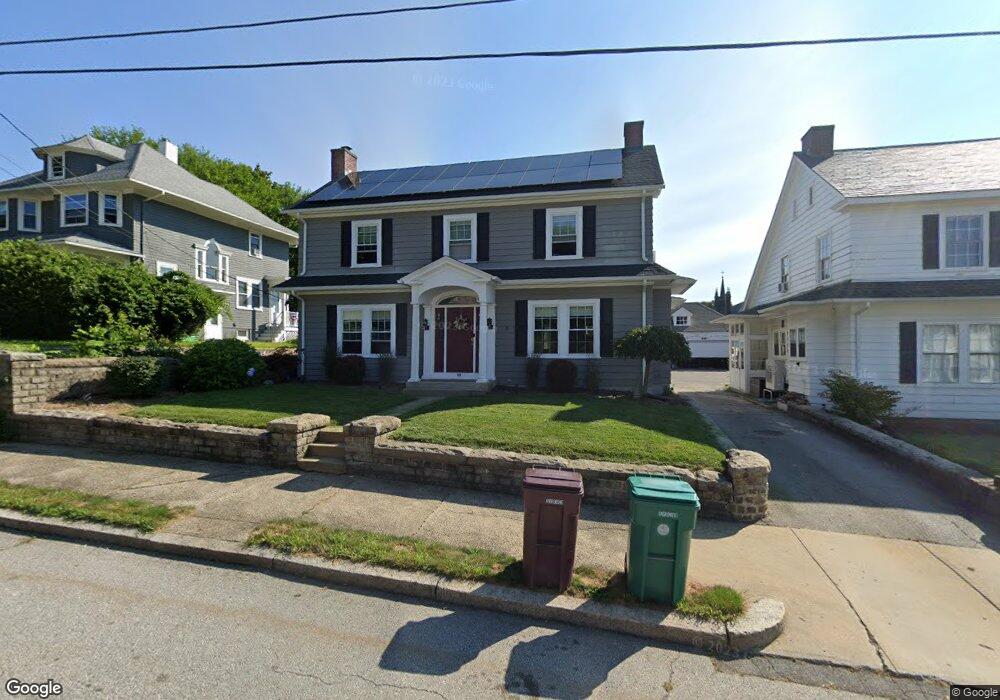
55 Highland St Woonsocket, RI 02895
North End NeighborhoodEstimated Value: $468,512 - $599,000
5
Beds
3
Baths
2,488
Sq Ft
$205/Sq Ft
Est. Value
About This Home
This home is located at 55 Highland St, Woonsocket, RI 02895 and is currently estimated at $509,628, approximately $204 per square foot. 55 Highland St is a home located in Providence County with nearby schools including Woonsocket High School, Rise Prep Mayoral Academy Middle School, and Rise Prep Mayoral Academy.
Ownership History
Date
Name
Owned For
Owner Type
Purchase Details
Closed on
Jan 11, 2021
Sold by
Halar Bryan
Bought by
Halar Bryan
Current Estimated Value
Home Financials for this Owner
Home Financials are based on the most recent Mortgage that was taken out on this home.
Original Mortgage
$261,000
Interest Rate
2.71%
Mortgage Type
New Conventional
Purchase Details
Closed on
Nov 21, 2008
Sold by
Violette A Sutherland
Bought by
Hockenberg Bryan
Home Financials for this Owner
Home Financials are based on the most recent Mortgage that was taken out on this home.
Original Mortgage
$211,212
Interest Rate
6.03%
Mortgage Type
Purchase Money Mortgage
Create a Home Valuation Report for This Property
The Home Valuation Report is an in-depth analysis detailing your home's value as well as a comparison with similar homes in the area
Home Values in the Area
Average Home Value in this Area
Purchase History
| Date | Buyer | Sale Price | Title Company |
|---|---|---|---|
| Halar Bryan | -- | None Available | |
| Halar Bryan | -- | None Available | |
| Halar Bryan | -- | None Available | |
| Hockenberg Bryan | $214,000 | -- | |
| Hockenberg Bryan | $214,000 | -- |
Source: Public Records
Mortgage History
| Date | Status | Borrower | Loan Amount |
|---|---|---|---|
| Previous Owner | Halar Bryan | $261,000 | |
| Previous Owner | Hockenberg Bryan | $205,200 | |
| Previous Owner | Hockenberg Bryan | $211,212 |
Source: Public Records
Tax History
| Year | Tax Paid | Tax Assessment Tax Assessment Total Assessment is a certain percentage of the fair market value that is determined by local assessors to be the total taxable value of land and additions on the property. | Land | Improvement |
|---|---|---|---|---|
| 2025 | $4,565 | $406,500 | $103,000 | $303,500 |
| 2024 | $4,215 | $289,900 | $84,100 | $205,800 |
| 2023 | $4,053 | $289,900 | $84,100 | $205,800 |
| 2022 | $4,053 | $289,900 | $84,100 | $205,800 |
| 2021 | $4,921 | $207,200 | $64,900 | $142,300 |
| 2020 | $4,973 | $207,200 | $64,900 | $142,300 |
| 2018 | $4,989 | $207,200 | $64,900 | $142,300 |
| 2017 | $5,475 | $181,900 | $62,400 | $119,500 |
| 2016 | $5,792 | $181,900 | $62,400 | $119,500 |
| 2015 | $6,654 | $181,900 | $62,400 | $119,500 |
| 2014 | $6,358 | $176,900 | $68,600 | $108,300 |
Source: Public Records
Map
Nearby Homes
- 36 Fairmount St
- 16 Canal St
- 154 156 Winter St
- 185 Spring St
- 164 W School St
- 107 Blackstone St
- 115 Railroad St
- 187 Boyden St
- 99 Cato St
- 217 4th Ave
- 0 N Main St Unit 1401765
- 123 4th Ave
- 120 East St
- 83 4th Ave
- 60 Fairlawn Ave
- 180 Allen St Unit 104
- 469 Winter St
- 481 N Main St
- 0 Holbrook Ln Unit 1402850
- 32 5th Ave
- 45 Highland St
- 67 Highland St
- 204 Harris Ave
- 89 Highland St
- 48 Highland St
- 60 Highland St
- 38 Highland St
- 202 Harris Ave
- 105 Highland St
- 210 Harris Ave
- 16 Highland St
- 94 Highland St
- 27 Lyman St
- 481 Blackstone St
- 121 Highland St
- 10 Highland St
- 47 Cold Spring Place
- 200 Harris Ave
- 45 Lyman St
- 37 Cold Spring Place
Your Personal Tour Guide
Ask me questions while you tour the home.