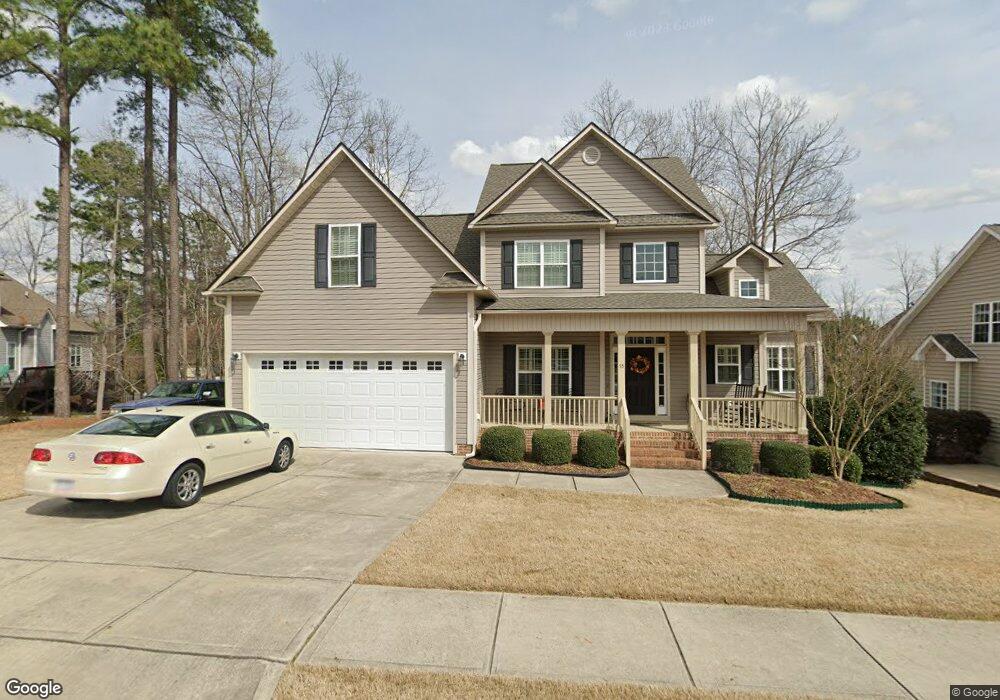
55 Hill Row Ln Unit 138 Clayton, NC 27527
Wilders NeighborhoodEstimated Value: $424,031 - $475,000
3
Beds
3
Baths
2,493
Sq Ft
$183/Sq Ft
Est. Value
About This Home
This home is located at 55 Hill Row Ln Unit 138, Clayton, NC 27527 and is currently estimated at $455,758, approximately $182 per square foot. 55 Hill Row Ln Unit 138 is a home located in Johnston County with nearby schools including River Dell Elementary School, Archer Lodge Middle School, and Corinth Holders High School.
Ownership History
Date
Name
Owned For
Owner Type
Purchase Details
Closed on
Jul 8, 2011
Sold by
Robert Massengill Construction Inc
Bought by
Canady E Glenn and Canady Kathryn P
Current Estimated Value
Home Financials for this Owner
Home Financials are based on the most recent Mortgage that was taken out on this home.
Original Mortgage
$130,000
Outstanding Balance
$89,478
Interest Rate
4.52%
Mortgage Type
New Conventional
Estimated Equity
$366,280
Purchase Details
Closed on
Jun 9, 2010
Sold by
Paragon Commercial Bank
Bought by
Robert Massengill Construction Inc
Purchase Details
Closed on
Jan 7, 2010
Sold by
Gidco Inc
Bought by
Paragon Commercial Bank
Purchase Details
Closed on
Apr 2, 2007
Sold by
S&S Land Development Llc
Bought by
Gidco Inc
Create a Home Valuation Report for This Property
The Home Valuation Report is an in-depth analysis detailing your home's value as well as a comparison with similar homes in the area
Home Values in the Area
Average Home Value in this Area
Purchase History
| Date | Buyer | Sale Price | Title Company |
|---|---|---|---|
| Canady E Glenn | $230,000 | None Available | |
| Robert Massengill Construction Inc | $79,500 | None Available | |
| Paragon Commercial Bank | $85,000 | None Available | |
| Gidco Inc | $176,000 | None Available |
Source: Public Records
Mortgage History
| Date | Status | Borrower | Loan Amount |
|---|---|---|---|
| Open | Canady E Glenn | $130,000 |
Source: Public Records
Tax History Compared to Growth
Tax History
| Year | Tax Paid | Tax Assessment Tax Assessment Total Assessment is a certain percentage of the fair market value that is determined by local assessors to be the total taxable value of land and additions on the property. | Land | Improvement |
|---|---|---|---|---|
| 2025 | $2,684 | $422,630 | $75,000 | $347,630 |
| 2024 | $2,137 | $263,870 | $40,000 | $223,870 |
| 2023 | $2,137 | $263,870 | $40,000 | $223,870 |
| 2022 | $2,164 | $263,870 | $40,000 | $223,870 |
| 2021 | $2,164 | $263,870 | $40,000 | $223,870 |
| 2020 | $2,243 | $263,870 | $40,000 | $223,870 |
| 2019 | $2,243 | $263,870 | $40,000 | $223,870 |
| 2018 | $2,150 | $247,170 | $40,000 | $207,170 |
| 2017 | $2,101 | $247,170 | $40,000 | $207,170 |
| 2016 | $2,101 | $247,170 | $40,000 | $207,170 |
| 2015 | $2,101 | $247,170 | $40,000 | $207,170 |
| 2014 | $2,101 | $247,170 | $40,000 | $207,170 |
Source: Public Records
Map
Nearby Homes
- 478 Curling Creek Dr
- 92 Summer Mist Ln
- 92 Summer Mist Ln Unit 164p
- 80 Summer Mist Ln
- 80 Summer Mist Ln Unit 165p
- 459 Windgate Dr
- 62 Summer Mist Ln
- 62 Summer Mist Ln Unit 167
- 323 Windgate Dr
- 59 Curling Creek Dr Unit I285
- TA3000 Plan at Copper Ridge at Flowers Plantation
- Abigale Plan at Copper Ridge at Flowers Plantation
- TA2300 Plan at Copper Ridge at Flowers Plantation
- Winslow Plan at Copper Ridge at Flowers Plantation
- Bayside Plan at Copper Ridge at Flowers Plantation
- Kipling Plan at Copper Ridge at Flowers Plantation
- Calgary Plan at Copper Ridge at Flowers Plantation
- Huntley Plan at Copper Ridge at Flowers Plantation
- Cyprus Plan at Copper Ridge at Flowers Plantation
- Riley Plan at Copper Ridge at Flowers Plantation
- 55 Hill Row Ln
- 75 Hill Row Ln
- 75 Hill Row Ln Unit 139
- 318 Mill Creek Dr Unit 136
- 318 Mill Creek Dr
- 35 Hill Row Ln Unit 137
- 35 Hill Row Ln
- 60 Hill Row Ln
- 60 Hill Row Ln Unit 141
- 19 Barrowby Dr Unit L183
- 19 Barrowby Dr
- 332 Mill Creek Dr
- 9 Barrowby Dr
- 44 Hill Row Ln Unit L140
- 44 Hill Row Ln
- 78 Hill Row Ln
- 29 Barrowby Dr Unit L182MCW
- 29 Barrowby Dr
- 22 Hill Ln
- 94 Hill Row Ln