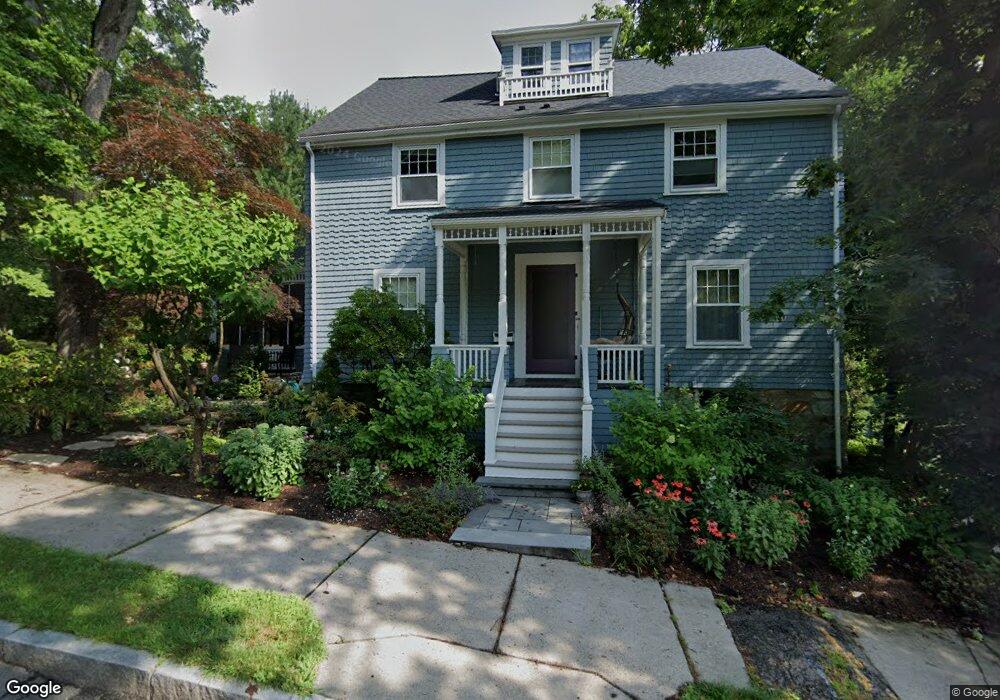
55 Hillside Rd Newton Highlands, MA 02461
Newton Highlands NeighborhoodEstimated Value: $1,778,657 - $1,997,000
4
Beds
4
Baths
2,148
Sq Ft
$877/Sq Ft
Est. Value
About This Home
This home is located at 55 Hillside Rd, Newton Highlands, MA 02461 and is currently estimated at $1,884,414, approximately $877 per square foot. 55 Hillside Rd is a home located in Middlesex County with nearby schools including Zervas Elementary School, Oak Hill Middle School, and Newton South High School.
Ownership History
Date
Name
Owned For
Owner Type
Purchase Details
Closed on
Jun 24, 2024
Sold by
Fried Jeffrey A and Berne Eve
Bought by
Berne-Fried Rt and Fried
Current Estimated Value
Purchase Details
Closed on
May 14, 2013
Sold by
Berne Eve
Bought by
Berne Eve and Fried Jeffrey A
Home Financials for this Owner
Home Financials are based on the most recent Mortgage that was taken out on this home.
Original Mortgage
$465,750
Interest Rate
3.6%
Mortgage Type
New Conventional
Purchase Details
Closed on
Jul 18, 2008
Sold by
Berne Eve and Fried Jeffrey A
Bought by
Berne Eve
Purchase Details
Closed on
Jul 1, 2003
Sold by
Wood Elizabeth and Wood Richard
Bought by
Berne Eve and Fried Jeffrey A
Purchase Details
Closed on
Jun 14, 2000
Sold by
Clarke Denise E
Bought by
Wood Richard and Kogos Elizabeth
Purchase Details
Closed on
Jul 30, 1990
Sold by
Elkin Michael J
Bought by
Clarke Denise E
Create a Home Valuation Report for This Property
The Home Valuation Report is an in-depth analysis detailing your home's value as well as a comparison with similar homes in the area
Home Values in the Area
Average Home Value in this Area
Purchase History
| Date | Buyer | Sale Price | Title Company |
|---|---|---|---|
| Berne-Fried Rt | -- | None Available | |
| Berne-Fried Rt | -- | None Available | |
| Berne Eve | -- | -- | |
| Berne Eve | -- | -- | |
| Berne Eve | -- | -- | |
| Berne Eve | $717,000 | -- | |
| Clarke Denise E | $287,500 | -- | |
| Berne Eve | -- | -- | |
| Berne Eve | -- | -- | |
| Berne Eve | $717,000 | -- | |
| Wood Richard | $567,000 | -- | |
| Clarke Denise E | $287,500 | -- |
Source: Public Records
Mortgage History
| Date | Status | Borrower | Loan Amount |
|---|---|---|---|
| Previous Owner | Berne Eve | $465,750 |
Source: Public Records
Tax History Compared to Growth
Tax History
| Year | Tax Paid | Tax Assessment Tax Assessment Total Assessment is a certain percentage of the fair market value that is determined by local assessors to be the total taxable value of land and additions on the property. | Land | Improvement |
|---|---|---|---|---|
| 2025 | $15,120 | $1,542,900 | $915,400 | $627,500 |
| 2024 | $14,620 | $1,498,000 | $888,700 | $609,300 |
| 2023 | $13,756 | $1,351,300 | $672,200 | $679,100 |
| 2022 | $13,063 | $1,241,700 | $622,400 | $619,300 |
| 2021 | $12,594 | $1,170,400 | $587,200 | $583,200 |
| 2020 | $5,176 | $1,170,400 | $587,200 | $583,200 |
| 2019 | $11,874 | $1,136,300 | $570,100 | $566,200 |
| 2018 | $4,818 | $1,048,600 | $516,300 | $532,300 |
| 2017 | $10,396 | $934,900 | $487,100 | $447,800 |
| 2016 | $9,954 | $874,700 | $455,200 | $419,500 |
| 2015 | $9,491 | $817,500 | $425,400 | $392,100 |
Source: Public Records
Map
Nearby Homes
- 2 Raeburn Terrace
- 1151 Walnut St Unit 205
- 1151 Walnut St Unit 405
- 1151 Walnut St Unit 207
- 35 Kingston Rd
- 1629 Centre St
- 1623-1625 Centre St
- 3 Glenmore Terrace Unit 2
- 1597 Centre St Unit 1597
- 1597 Centre St
- 200 Lincoln St
- 35 Bradford Rd
- 956 Walnut St Unit 4
- 956 Walnut St Unit 7
- 956 Walnut St Unit 6
- 28 Wilson Cir Unit 28
- 32 Wilson Cir Unit 32
- 26 Wilson Cir Unit 26
- 1114 Beacon St Unit 106
- 1114 Beacon St Unit 203
- 49 Hillside Rd
- 54 Hillside Rd
- 4 Chester St
- 43 Hillside Rd
- 22 Terrace Ave
- 3 Columbus St
- 10 Chester St
- 37 Hillside Rd
- 9 Columbus St
- 5 Chester St
- 19 Terrace Ave Unit 21
- 1 Raeburn Terrace
- 18 Chester St
- 41 Terrace Ave
- 41 Terrace Ave Unit A
- 41 Terrace Ave Unit 1
- 6 Columbus St
- 39 Terrace Ave Unit 41
- 39 Terrace Ave Unit 1
- 15 Terrace Ave