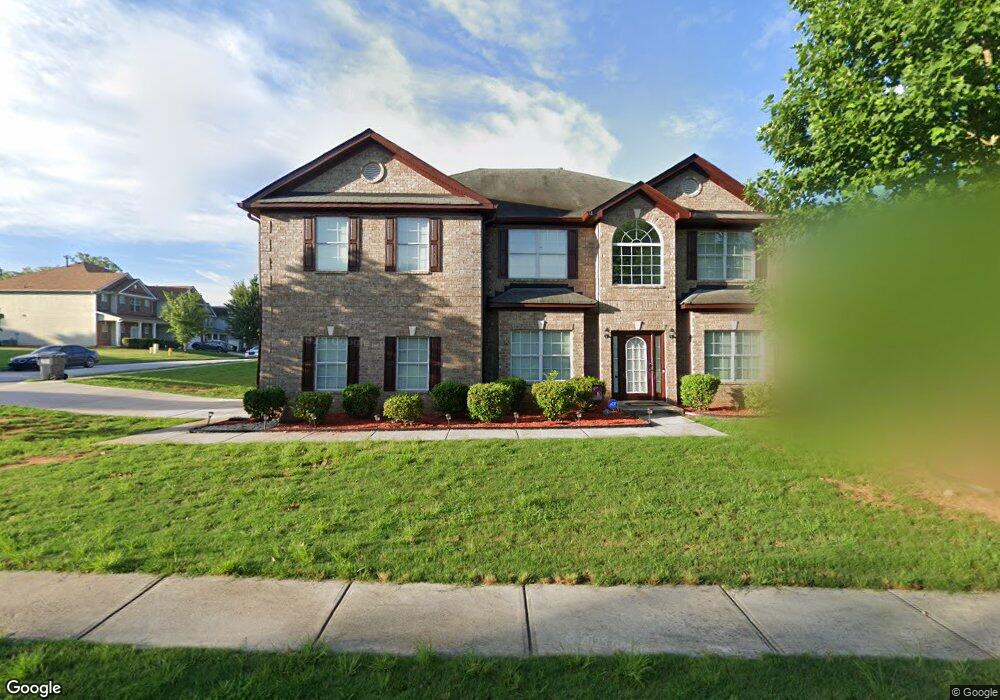
55 Hinton Chase Pkwy Covington, GA 30016
Estimated Value: $394,176 - $431,000
--
Bed
2
Baths
3,680
Sq Ft
$112/Sq Ft
Est. Value
About This Home
This home is located at 55 Hinton Chase Pkwy, Covington, GA 30016 and is currently estimated at $413,544, approximately $112 per square foot. 55 Hinton Chase Pkwy is a home located in Newton County with nearby schools including Live Oak Elementary School, Clements Middle School, and Newton High School.
Ownership History
Date
Name
Owned For
Owner Type
Purchase Details
Closed on
Nov 15, 2018
Sold by
Imeokparia Peter
Bought by
Smith Jones Travis and Smith Jones Alexis D
Current Estimated Value
Home Financials for this Owner
Home Financials are based on the most recent Mortgage that was taken out on this home.
Original Mortgage
$243,508
Outstanding Balance
$211,915
Interest Rate
4.8%
Mortgage Type
FHA
Estimated Equity
$201,629
Purchase Details
Closed on
Jun 17, 2013
Sold by
Reo Funding Solutions Iii
Bought by
Rh Hinton Chase Llp
Purchase Details
Closed on
Oct 16, 2012
Sold by
Pnc Bank National Associat
Bought by
Reo Funding Solutions Iii Llc
Purchase Details
Closed on
Nov 30, 2009
Sold by
Legacy Cmntys Of Hinton Chase
Bought by
Imeokparia Peter
Home Financials for this Owner
Home Financials are based on the most recent Mortgage that was taken out on this home.
Original Mortgage
$162,011
Interest Rate
4.82%
Mortgage Type
FHA
Create a Home Valuation Report for This Property
The Home Valuation Report is an in-depth analysis detailing your home's value as well as a comparison with similar homes in the area
Home Values in the Area
Average Home Value in this Area
Purchase History
| Date | Buyer | Sale Price | Title Company |
|---|---|---|---|
| Smith Jones Travis | $248,000 | -- | |
| Rh Hinton Chase Llp | $900,000 | -- | |
| Reo Funding Solutions Iii Llc | $300,000 | -- | |
| Imeokparia Peter | $165,000 | -- |
Source: Public Records
Mortgage History
| Date | Status | Borrower | Loan Amount |
|---|---|---|---|
| Open | Smith Jones Travis | $243,508 | |
| Previous Owner | Imeokparia Peter | $162,011 |
Source: Public Records
Tax History Compared to Growth
Tax History
| Year | Tax Paid | Tax Assessment Tax Assessment Total Assessment is a certain percentage of the fair market value that is determined by local assessors to be the total taxable value of land and additions on the property. | Land | Improvement |
|---|---|---|---|---|
| 2024 | $4,238 | $169,480 | $24,000 | $145,480 |
| 2023 | $4,488 | $167,680 | $11,200 | $156,480 |
| 2022 | $3,452 | $129,480 | $11,200 | $118,280 |
| 2021 | $2,991 | $101,080 | $11,200 | $89,880 |
| 2020 | $3,119 | $95,520 | $11,200 | $84,320 |
| 2019 | $3,110 | $93,880 | $11,200 | $82,680 |
| 2018 | $1,397 | $80,160 | $11,200 | $68,960 |
| 2017 | $2,921 | $83,880 | $14,400 | $69,480 |
| 2016 | $2,715 | $77,880 | $8,400 | $69,480 |
| 2015 | $1,906 | $54,320 | $8,400 | $45,920 |
| 2014 | $1,735 | $49,520 | $0 | $0 |
Source: Public Records
Map
Nearby Homes
- 65 Hinton Chase Pkwy
- 30 Vilote Fern Ln
- 15 Vilote Fern Ln
- 10 Vilote Fern Ln
- 70 Vilote Fern Ln
- 75 Hinton Chase Pkwy
- 50 Hinton Chase Pkwy
- 25 Vilote Fern Ln
- 40 Hinton Chase Pkwy
- 60 Hinton Chase Pkwy
- 80 Vilote Fern Ln Unit 132
- 80 Vilote Fern Ln
- 25 Hinton Chase Pkwy Unit 145
- 121 Vilote Fern Ln
- 85 Hinton Chase Pkwy Unit 140
- 85 Hinton Chase Pkwy
- 30 Hinton Chase Pkwy
- 70 Hinton Chase Pkwy
- 35 Vilote Fern Ln
- 90 Vilote Fern Ln