Estimated Value: $555,000 - $771,000
3
Beds
2
Baths
1,136
Sq Ft
$552/Sq Ft
Est. Value
About This Home
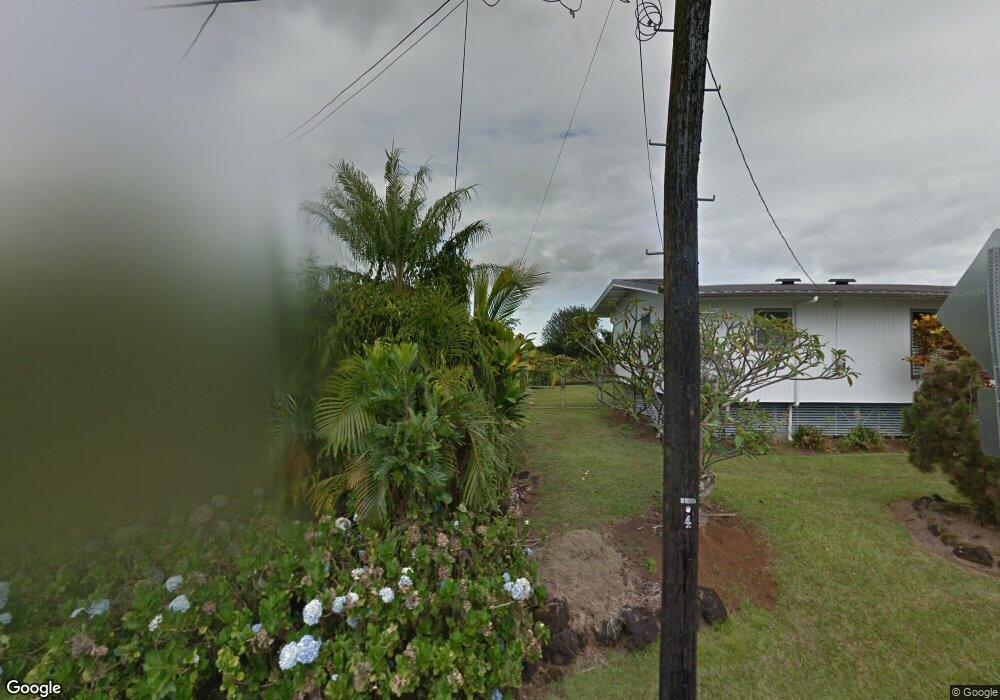
This home is located at 55 Hokupaa St Unit 3462, Hilo, HI 96720 and is currently estimated at $627,026, approximately $551 per square foot. 55 Hokupaa St Unit 3462 is a home located in Hawaii County with nearby schools including Waiakeawaena Elementary School, Waiakea Intermediate School, and Waiakea High School.
Ownership History
Date
Name
Owned For
Owner Type
Purchase Details
Closed on
Dec 29, 2017
Sold by
Coito Colleen Roselani
Bought by
Alili Yamura Kaylyn Alohilani and Alili Pasco Brennen Conrad Kaimana
Current Estimated Value
Home Financials for this Owner
Home Financials are based on the most recent Mortgage that was taken out on this home.
Original Mortgage
$265,000
Interest Rate
3%
Mortgage Type
Adjustable Rate Mortgage/ARM
Purchase Details
Closed on
Dec 28, 2001
Sold by
Hawaii Island Community Development Corp
Bought by
Yamura Colleen Roselani
Home Financials for this Owner
Home Financials are based on the most recent Mortgage that was taken out on this home.
Original Mortgage
$128,900
Interest Rate
7.01%
Mortgage Type
Purchase Money Mortgage
Create a Home Valuation Report for This Property
The Home Valuation Report is an in-depth analysis detailing your home's value as well as a comparison with similar homes in the area
Home Values in the Area
Average Home Value in this Area
Purchase History
| Date | Buyer | Sale Price | Title Company |
|---|---|---|---|
| Alili Yamura Kaylyn Alohilani | -- | Tg | |
| Yamura Colleen Roselani | $52,600 | -- |
Source: Public Records
Mortgage History
| Date | Status | Borrower | Loan Amount |
|---|---|---|---|
| Previous Owner | Alili Yamura Kaylyn Alohilani | $265,000 | |
| Previous Owner | Yamura Colleen Roselani | $128,900 | |
| Closed | Yamura Colleen Roselani | $3,716 |
Source: Public Records
Tax History Compared to Growth
Tax History
| Year | Tax Paid | Tax Assessment Tax Assessment Total Assessment is a certain percentage of the fair market value that is determined by local assessors to be the total taxable value of land and additions on the property. | Land | Improvement |
|---|---|---|---|---|
| 2025 | $1,258 | $336,500 | $105,900 | $230,600 |
| 2024 | $1,258 | $326,700 | $105,900 | $220,800 |
| 2023 | $1,253 | $317,200 | $105,900 | $211,300 |
| 2022 | $1,269 | $308,000 | $105,900 | $202,100 |
| 2021 | $1,225 | $299,000 | $105,900 | $193,100 |
| 2020 | $1,207 | $295,200 | $105,900 | $189,300 |
| 2019 | $3,049 | $274,700 | $104,200 | $170,500 |
| 2018 | $768 | $206,100 | $63,800 | $142,300 |
| 2017 | $739 | $200,100 | $63,800 | $136,300 |
| 2016 | $710 | $194,300 | $63,800 | $130,500 |
| 2015 | -- | $188,600 | $63,800 | $124,800 |
| 2014 | -- | $183,100 | $63,800 | $119,300 |
Source: Public Records
Map
Nearby Homes
- 1646 Oneawa Place
- 508 Ekela St
- 106 Laula Rd
- 280 Laula Rd
- 1594 Kaunala Place
- 250 Laula
- 446 Ainaola Dr
- 527 Iwalani St
- 450 Pohakulani St
- 0 Ainalako Rd
- 845 Uilani Place
- 3047 Lou St
- 723 W Kawailani St
- 806 Uilani Place
- 1588 Mailani St
- 346 Kanoelani St
- 856 Hoolala Place
- 1317 S Kumuwaina Place
- 2557 Kinoole St
- 2615 Kinoole St
- 55 Hokupaa St Unit 3467
- 55 Hokupaa St Unit 3460
- 55 Hokupaa St Unit 3464
- 39 Hokupaa St
- 51 Hokupaa St
- 43 Hokupaa St Unit 416
- 43 Hokupaa St Unit 414
- 43 Hokupaa St Unit 412
- 43 Hokupaa St Unit 410
- 48 Hokupaa St
- 61 Hokupaa St
- 40 Hokupaa St
- 170 Palua Loop
- 33 Hokupaa St
- 180 Palua Loop
- 166 Palua Loop
- 64 Hokupaa St
- 27 Hokupaa St
- 31 Hokupaa St
- 71 Hokupaa St