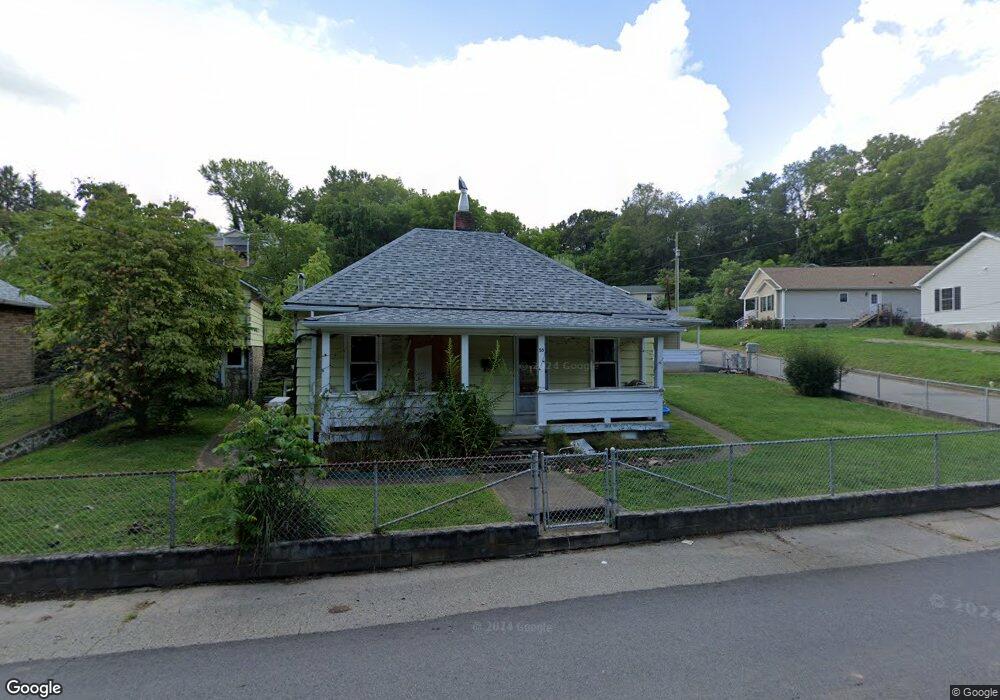
55 Holtzclaw St Canton, NC 28716
Estimated Value: $238,000 - $246,173
2
Beds
1
Bath
744
Sq Ft
$326/Sq Ft
Est. Value
About This Home
This home is located at 55 Holtzclaw St, Canton, NC 28716 and is currently estimated at $242,793, approximately $326 per square foot. 55 Holtzclaw St is a home located in Haywood County with nearby schools including Meadowbrook Elementary School, Canton Middle, and Pisgah High School.
Ownership History
Date
Name
Owned For
Owner Type
Purchase Details
Closed on
Nov 30, 2021
Sold by
Covington Barry Olin and Covington Janet
Bought by
Mills Megan
Current Estimated Value
Home Financials for this Owner
Home Financials are based on the most recent Mortgage that was taken out on this home.
Original Mortgage
$182,000
Outstanding Balance
$167,482
Interest Rate
3.15%
Mortgage Type
New Conventional
Estimated Equity
$75,311
Purchase Details
Closed on
Sep 12, 2005
Sold by
Johnson Ray Carroll
Bought by
Whitaker Bobby Parks Covington and Covington Barry Olin
Create a Home Valuation Report for This Property
The Home Valuation Report is an in-depth analysis detailing your home's value as well as a comparison with similar homes in the area
Home Values in the Area
Average Home Value in this Area
Purchase History
| Date | Buyer | Sale Price | Title Company |
|---|---|---|---|
| Mills Megan | $180,000 | None Available | |
| Mills Megan | $180,000 | None Listed On Document | |
| Whitaker Bobby Parks Covington | -- | None Available |
Source: Public Records
Mortgage History
| Date | Status | Borrower | Loan Amount |
|---|---|---|---|
| Open | Mills Megan | $182,000 | |
| Closed | Mills Megan | $182,000 |
Source: Public Records
Tax History
| Year | Tax Paid | Tax Assessment Tax Assessment Total Assessment is a certain percentage of the fair market value that is determined by local assessors to be the total taxable value of land and additions on the property. | Land | Improvement |
|---|---|---|---|---|
| 2025 | -- | $133,800 | $22,000 | $111,800 |
| 2024 | $9 | $133,800 | $22,000 | $111,800 |
| 2023 | $895 | $133,800 | $22,000 | $111,800 |
| 2022 | $875 | $133,800 | $22,000 | $111,800 |
| 2021 | $461 | $133,800 | $22,000 | $111,800 |
| 2020 | $256 | $87,600 | $15,700 | $71,900 |
| 2019 | $333 | $87,600 | $15,700 | $71,900 |
| 2018 | $333 | $87,600 | $15,700 | $71,900 |
| 2017 | $333 | $87,600 | $0 | $0 |
| 2016 | $344 | $88,900 | $0 | $0 |
| 2015 | $344 | $88,900 | $0 | $0 |
| 2014 | $329 | $88,900 | $0 | $0 |
Source: Public Records
Map
Nearby Homes
- 382 Holtzclaw St
- 355 Johnson Dr
- 84 Wood Lily Dr
- 687 Holtzclaw Rd
- 318 Academy St
- 113 Hillside St
- 163 Pharr St
- TBD Valley St
- 239 Northside St
- 1397 Dutch Cove Rd
- Lot 2 Kuykendall Ln
- 106 Pressley Rd
- 130 Crestview St
- 91 Star Ridge Rd
- 28 Back Stage Pass
- 172 Reed St
- 228 Chestnut Mountain Rd
- 223 N Main St
- 36 Kimberly Dr
- 00 Bob Wood Dr
Your Personal Tour Guide
Ask me questions while you tour the home.