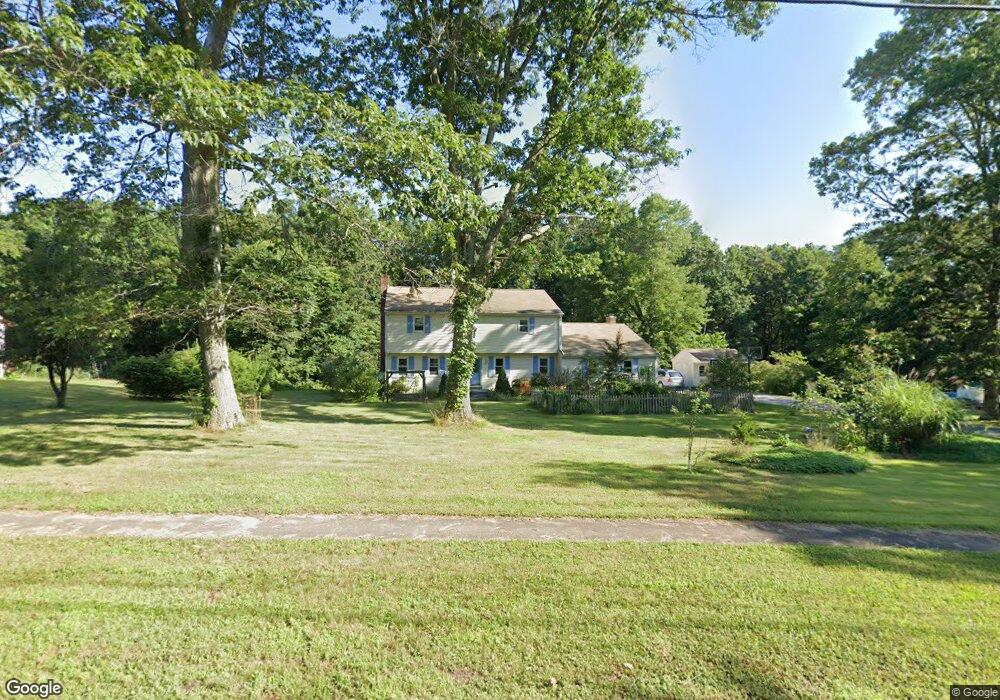
55 Homonick Rd Colchester, CT 06415
Estimated Value: $450,577 - $519,000
4
Beds
3
Baths
2,708
Sq Ft
$180/Sq Ft
Est. Value
About This Home
This home is located at 55 Homonick Rd, Colchester, CT 06415 and is currently estimated at $486,894, approximately $179 per square foot. 55 Homonick Rd is a home located in New London County with nearby schools including Colchester Elementary School, Jack Jackter Intermediate School, and William J. Johnston Middle School.
Ownership History
Date
Name
Owned For
Owner Type
Purchase Details
Closed on
Oct 10, 2014
Sold by
Labossiere Jennifer A
Bought by
Pulse Jennifer A and Pulse Matthew R
Current Estimated Value
Home Financials for this Owner
Home Financials are based on the most recent Mortgage that was taken out on this home.
Original Mortgage
$226,650
Outstanding Balance
$172,755
Interest Rate
4.1%
Mortgage Type
New Conventional
Estimated Equity
$314,139
Purchase Details
Closed on
Sep 29, 2003
Sold by
Kupczak Peter
Bought by
Labossiere Jennifer and Pulse Mathew
Home Financials for this Owner
Home Financials are based on the most recent Mortgage that was taken out on this home.
Original Mortgage
$265,500
Interest Rate
6.29%
Mortgage Type
Purchase Money Mortgage
Purchase Details
Closed on
Apr 21, 1994
Sold by
Lovley Mark N and Lovley Christine
Bought by
Kupczak Peter Z and Kupczak Grace
Home Financials for this Owner
Home Financials are based on the most recent Mortgage that was taken out on this home.
Original Mortgage
$126,000
Interest Rate
7.6%
Mortgage Type
Purchase Money Mortgage
Create a Home Valuation Report for This Property
The Home Valuation Report is an in-depth analysis detailing your home's value as well as a comparison with similar homes in the area
Home Values in the Area
Average Home Value in this Area
Purchase History
| Date | Buyer | Sale Price | Title Company |
|---|---|---|---|
| Pulse Jennifer A | -- | -- | |
| Labossiere Jennifer | $295,000 | -- | |
| Kupczak Peter Z | $140,000 | -- |
Source: Public Records
Mortgage History
| Date | Status | Borrower | Loan Amount |
|---|---|---|---|
| Open | Pulse Jennifer A | $226,650 | |
| Previous Owner | Kupczak Peter Z | $265,500 | |
| Previous Owner | Kupczak Peter Z | $188,000 | |
| Previous Owner | Kupczak Peter Z | $152,000 | |
| Previous Owner | Kupczak Peter Z | $126,000 |
Source: Public Records
Tax History Compared to Growth
Tax History
| Year | Tax Paid | Tax Assessment Tax Assessment Total Assessment is a certain percentage of the fair market value that is determined by local assessors to be the total taxable value of land and additions on the property. | Land | Improvement |
|---|---|---|---|---|
| 2025 | $6,205 | $207,400 | $39,100 | $168,300 |
| 2024 | $5,946 | $207,400 | $39,100 | $168,300 |
| 2023 | $5,645 | $207,400 | $39,100 | $168,300 |
| 2022 | $5,616 | $207,400 | $39,100 | $168,300 |
| 2021 | $4,609 | $178,100 | $39,100 | $139,000 |
| 2020 | $5,849 | $178,100 | $39,100 | $139,000 |
| 2019 | $4,726 | $178,100 | $39,100 | $139,000 |
| 2018 | $4,700 | $178,100 | $39,100 | $139,000 |
| 2017 | $5,765 | $178,100 | $39,100 | $139,000 |
| 2016 | $5,644 | $182,600 | $50,700 | $131,900 |
| 2015 | $5,617 | $182,600 | $50,700 | $131,900 |
| 2014 | $5,582 | $182,600 | $50,700 | $131,900 |
Source: Public Records
Map
Nearby Homes
- 66 Stanavage Rd
- 65 McDonald Rd
- 376 West Rd
- 152 Stanavage Rd
- 10 West Rd
- 59 Kramer Rd
- 99 Lake Hayward Rd
- 208 Chestnut Hill Rd
- 251 Chestnut Hill Rd
- 90 Lake Shore Dr
- 608 West Rd
- 73 Lake Shore Dr
- 38 Briarcliffe Rd
- 80 Sashel Ln
- 119 Rattlesnake Ledge Rd
- 251 Westerly Terrace
- 3 Westerly Terrace
- 31 Joseph Ln
- 129 Salem Rd
- 140 Halls Hill Rd
- 53 Homonick Rd
- 59 Homonick Rd
- 52 Homonick Rd
- 45 Homonick Rd
- 282 McDonald Rd
- 321 McDonald Rd
- 43 Homonick Rd
- 284 McDonald Rd
- 337 McDonald Rd
- 286 McDonald Rd
- 291 McDonald Rd
- 309 McDonald Rd
- 29 Homonick Rd
- 280 McDonald Rd
- 287 McDonald Rd
- 8 Shadbush Dr
- 353 McDonald Rd
- 347 McDonald Rd
- 358 McDonald Rd
- 271 McDonald Rd