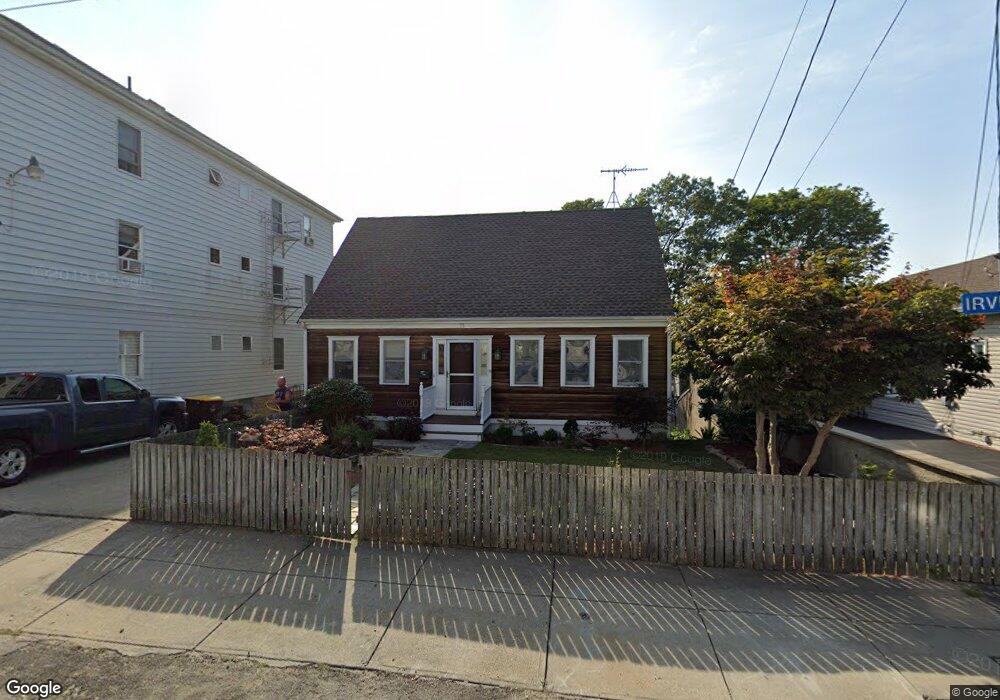
55 Irving St Unit 1 Fall River, MA 02723
Flint NeighborhoodEstimated Value: $420,000 - $474,000
3
Beds
2
Baths
1,559
Sq Ft
$290/Sq Ft
Est. Value
About This Home
This home is located at 55 Irving St Unit 1, Fall River, MA 02723 and is currently estimated at $452,334, approximately $290 per square foot. 55 Irving St Unit 1 is a home located in Bristol County with nearby schools including Samuel Watson, Talbot Innovation School, and B M C Durfee High School.
Ownership History
Date
Name
Owned For
Owner Type
Purchase Details
Closed on
Dec 5, 2019
Sold by
Monte Lorraine Est
Bought by
Winchell Ashley T
Current Estimated Value
Home Financials for this Owner
Home Financials are based on the most recent Mortgage that was taken out on this home.
Original Mortgage
$178,500
Outstanding Balance
$157,833
Interest Rate
3.75%
Mortgage Type
New Conventional
Estimated Equity
$294,501
Purchase Details
Closed on
Jun 17, 2016
Sold by
Seay Geoffrey F
Bought by
Monte Lorraine
Purchase Details
Closed on
Jul 19, 2004
Sold by
Monte Bert
Bought by
Seay Geoffrey F
Home Financials for this Owner
Home Financials are based on the most recent Mortgage that was taken out on this home.
Original Mortgage
$212,000
Interest Rate
6.25%
Mortgage Type
Purchase Money Mortgage
Create a Home Valuation Report for This Property
The Home Valuation Report is an in-depth analysis detailing your home's value as well as a comparison with similar homes in the area
Home Values in the Area
Average Home Value in this Area
Purchase History
| Date | Buyer | Sale Price | Title Company |
|---|---|---|---|
| Winchell Ashley T | $260,000 | None Available | |
| Monte Lorraine | $190,000 | -- | |
| Seay Geoffrey F | $265,000 | -- |
Source: Public Records
Mortgage History
| Date | Status | Borrower | Loan Amount |
|---|---|---|---|
| Open | Winchell Ashley T | $178,500 | |
| Previous Owner | Seay Geoffrey F | $47,500 | |
| Previous Owner | Seay Geoffrey F | $212,000 | |
| Previous Owner | Seay Geoffrey F | $39,750 | |
| Previous Owner | Seay Geoffrey F | $70,000 |
Source: Public Records
Tax History
| Year | Tax Paid | Tax Assessment Tax Assessment Total Assessment is a certain percentage of the fair market value that is determined by local assessors to be the total taxable value of land and additions on the property. | Land | Improvement |
|---|---|---|---|---|
| 2025 | $4,017 | $350,800 | $127,000 | $223,800 |
| 2024 | $3,792 | $330,000 | $122,200 | $207,800 |
| 2023 | $3,842 | $313,100 | $104,800 | $208,300 |
| 2022 | $3,203 | $268,500 | $95,200 | $173,300 |
| 2021 | $3,203 | $231,600 | $88,100 | $143,500 |
| 2020 | $2,993 | $207,100 | $84,300 | $122,800 |
| 2019 | $2,899 | $198,800 | $80,300 | $118,500 |
| 2018 | $2,889 | $197,600 | $78,800 | $118,800 |
| 2017 | $2,758 | $197,000 | $80,400 | $116,600 |
| 2016 | $2,648 | $194,300 | $83,800 | $110,500 |
| 2015 | $2,541 | $194,300 | $80,700 | $113,600 |
| 2014 | $2,497 | $198,500 | $84,900 | $113,600 |
Source: Public Records
Map
Nearby Homes
- 38 Eaton St
- 712 Eastern Ave
- 1768 Pleasant St
- 1792 Pleasant St Unit 1808
- 215 Earle St Unit 1
- 219 Earle St Unit 3
- 217 Earle St Unit 2
- 529 Eastern Ave
- 144 Choate St
- 366 Alden St
- 756 County St
- 352 Barnes St
- 3 Edgemond St
- 34 Alsop St
- 152 Alden St
- 178 Thomas St
- 580 County St
- 25 Lebanon St Unit D
- 25 Lebanon St Unit C
- 274 Harrison St
Your Personal Tour Guide
Ask me questions while you tour the home.