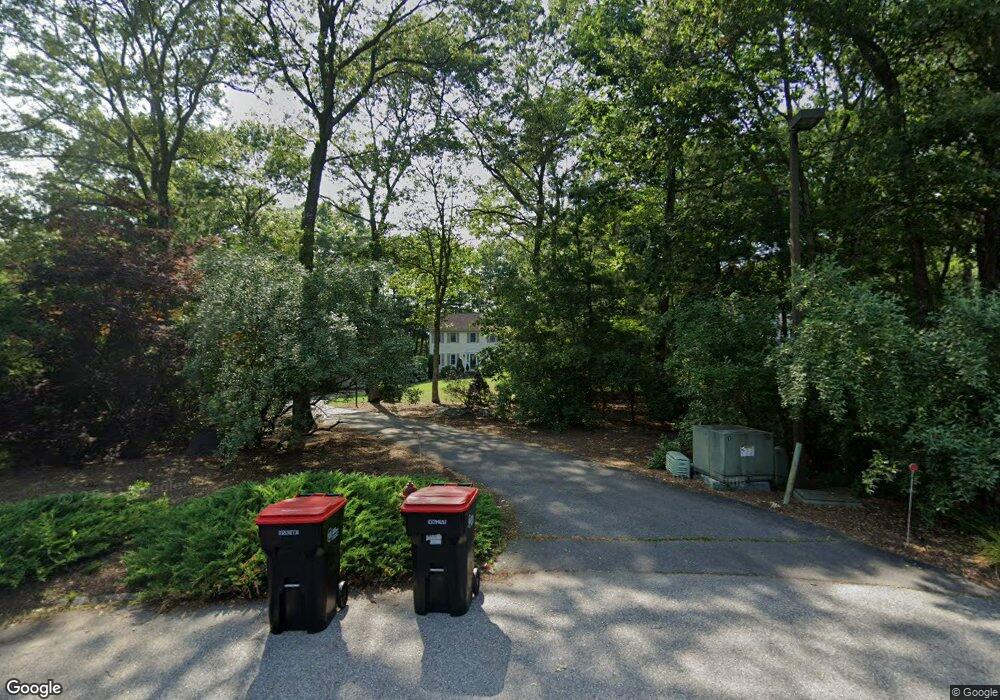
55 Ivy Cir Bridgewater, MA 02324
Estimated Value: $655,884 - $741,000
3
Beds
3
Baths
1,632
Sq Ft
$423/Sq Ft
Est. Value
About This Home
This home is located at 55 Ivy Cir, Bridgewater, MA 02324 and is currently estimated at $690,971, approximately $423 per square foot. 55 Ivy Cir is a home located in Plymouth County with nearby schools including Mitchell Elementary School, Williams Intermediate School, and Bridgewater Middle School.
Ownership History
Date
Name
Owned For
Owner Type
Purchase Details
Closed on
Apr 30, 2004
Sold by
Kalil Samuel N
Bought by
Silverman Jason M and Silverman Stacey L
Current Estimated Value
Purchase Details
Closed on
Jan 15, 2003
Sold by
Bosader Karen and Bosader Peter A
Bought by
Kalil Samuel N
Purchase Details
Closed on
Mar 12, 2002
Sold by
Rothman Mary L and Rothman Mark A
Bought by
Bosader Peter A and Bosader Karen
Purchase Details
Closed on
Dec 2, 1997
Sold by
Pine & Spruce Rlty
Bought by
Rothman Mark A and Rothman Mary L
Create a Home Valuation Report for This Property
The Home Valuation Report is an in-depth analysis detailing your home's value as well as a comparison with similar homes in the area
Home Values in the Area
Average Home Value in this Area
Purchase History
| Date | Buyer | Sale Price | Title Company |
|---|---|---|---|
| Silverman Jason M | $403,800 | -- | |
| Kalil Samuel N | $372,000 | -- | |
| Bosader Peter A | $331,000 | -- | |
| Rothman Mark A | $65,000 | -- |
Source: Public Records
Mortgage History
| Date | Status | Borrower | Loan Amount |
|---|---|---|---|
| Open | Rothman Mark A | $310,000 | |
| Closed | Rothman Mark A | $30,000 | |
| Closed | Rothman Mark A | $306,500 |
Source: Public Records
Tax History Compared to Growth
Tax History
| Year | Tax Paid | Tax Assessment Tax Assessment Total Assessment is a certain percentage of the fair market value that is determined by local assessors to be the total taxable value of land and additions on the property. | Land | Improvement |
|---|---|---|---|---|
| 2025 | $6,838 | $578,000 | $236,800 | $341,200 |
| 2024 | $6,599 | $543,600 | $225,500 | $318,100 |
| 2023 | $6,529 | $508,500 | $210,700 | $297,800 |
| 2022 | $6,398 | $446,800 | $184,900 | $261,900 |
| 2021 | $5,987 | $413,500 | $165,100 | $248,400 |
| 2020 | $5,861 | $397,900 | $158,700 | $239,200 |
| 2019 | $5,781 | $389,800 | $158,700 | $231,100 |
| 2018 | $9,820 | $366,300 | $154,100 | $212,200 |
| 2017 | $5,407 | $346,400 | $154,100 | $192,300 |
| 2016 | $5,181 | $333,400 | $151,100 | $182,300 |
| 2015 | $5,216 | $321,200 | $146,700 | $174,500 |
| 2014 | $5,104 | $314,100 | $142,400 | $171,700 |
Source: Public Records
Map
Nearby Homes
- 25 Twin Diamond Dr
- 40 Country Club Dr
- 1570 Old Pleasant St
- 1442 Old Pleasant St
- 357 Vernon St
- 29 Saddle Dr
- 1037 N Main St
- 905 Vernon St
- 970 N Main St
- 5 Jaclyn Way
- 88 Boxwood Ln
- 848 N Main St
- 74 Vernon St
- 54 Grange Park
- 115 Goldfinch Dr
- 21 Sully Rd
- 643 Center St
- 165 Grange Park
- 100 Francine Rd
- 35 Stockbridge Rd