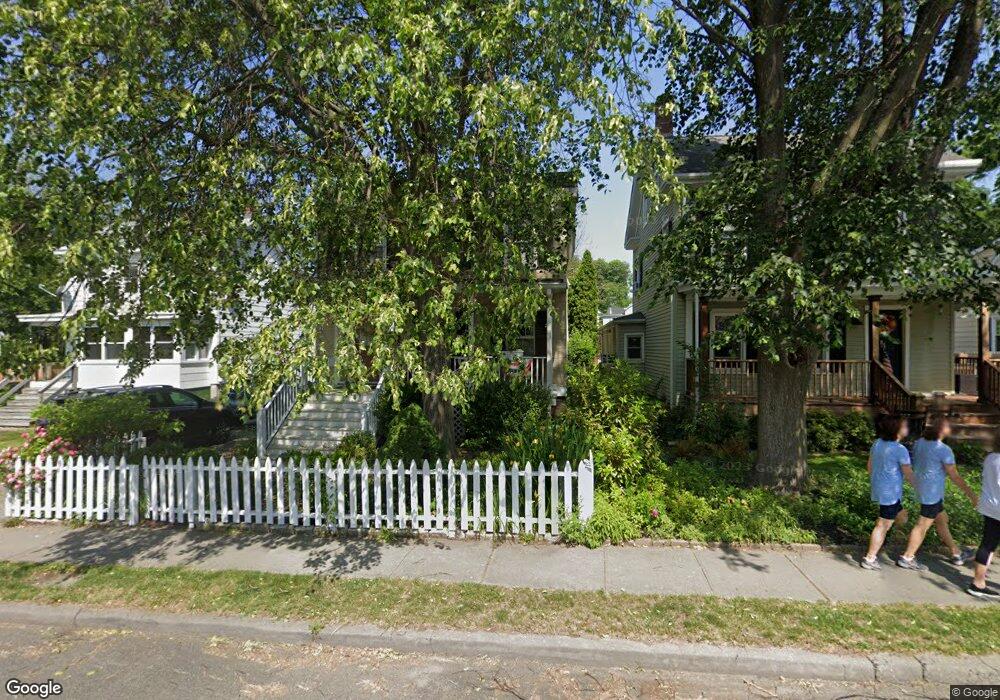
55 James St Morristown, NJ 07960
Estimated Value: $752,271 - $915,000
--
Bed
--
Bath
1,891
Sq Ft
$435/Sq Ft
Est. Value
About This Home
This home is located at 55 James St, Morristown, NJ 07960 and is currently estimated at $821,818, approximately $434 per square foot. 55 James St is a home located in Morris County with nearby schools including Hillcrest School, Thomas Jefferson School, and Alexander Hamilton School.
Ownership History
Date
Name
Owned For
Owner Type
Purchase Details
Closed on
Apr 28, 2005
Sold by
Solimo Cara
Bought by
Degeorge Christopher
Current Estimated Value
Home Financials for this Owner
Home Financials are based on the most recent Mortgage that was taken out on this home.
Original Mortgage
$400,000
Outstanding Balance
$211,369
Interest Rate
6.05%
Mortgage Type
New Conventional
Estimated Equity
$610,449
Purchase Details
Closed on
Jun 27, 2001
Sold by
Kiefer John
Bought by
Solimo Cara and Randall Grant
Home Financials for this Owner
Home Financials are based on the most recent Mortgage that was taken out on this home.
Original Mortgage
$269,700
Interest Rate
7.2%
Purchase Details
Closed on
Jul 17, 1998
Sold by
Carr David W and Carr Carol
Bought by
Kiefer John M and Rossilli Kiefer Karen
Home Financials for this Owner
Home Financials are based on the most recent Mortgage that was taken out on this home.
Original Mortgage
$185,600
Interest Rate
6.98%
Create a Home Valuation Report for This Property
The Home Valuation Report is an in-depth analysis detailing your home's value as well as a comparison with similar homes in the area
Home Values in the Area
Average Home Value in this Area
Purchase History
| Date | Buyer | Sale Price | Title Company |
|---|---|---|---|
| Degeorge Christopher | $520,000 | -- | |
| Solimo Cara | $300,000 | -- | |
| Kiefer John M | $232,000 | -- |
Source: Public Records
Mortgage History
| Date | Status | Borrower | Loan Amount |
|---|---|---|---|
| Open | Degeorge Christopher | $400,000 | |
| Previous Owner | Solimo Cara | $269,700 | |
| Previous Owner | Kiefer John M | $185,600 |
Source: Public Records
Tax History Compared to Growth
Tax History
| Year | Tax Paid | Tax Assessment Tax Assessment Total Assessment is a certain percentage of the fair market value that is determined by local assessors to be the total taxable value of land and additions on the property. | Land | Improvement |
|---|---|---|---|---|
| 2025 | $7,258 | $460,800 | $218,300 | $242,500 |
| 2024 | $9,343 | $460,800 | $218,300 | $242,500 |
| 2023 | $9,343 | $321,500 | $182,300 | $139,200 |
| 2022 | $9,233 | $321,500 | $182,300 | $139,200 |
| 2021 | $9,233 | $321,500 | $182,300 | $139,200 |
| 2020 | $9,269 | $321,500 | $182,300 | $139,200 |
| 2019 | $9,266 | $321,500 | $182,300 | $139,200 |
| 2018 | $9,147 | $321,500 | $182,300 | $139,200 |
| 2017 | $8,873 | $321,500 | $182,300 | $139,200 |
| 2016 | $8,645 | $321,500 | $182,300 | $139,200 |
| 2015 | $8,439 | $321,500 | $182,300 | $139,200 |
| 2014 | $8,346 | $321,500 | $182,300 | $139,200 |
Source: Public Records
Map
Nearby Homes
- 81 Macculloch Ave
- 48 Miller Rd Unit 50
- 31 Hamilton Rd
- 2 Altamont Ct Unit 25
- 9 Carla Ct
- 21 Franklin Place
- 40 W Park Place Unit 404
- 40 Park - Unit 315 Unit 315
- 10 Westminster Place
- 194 James St
- 7 Sherwood Dr
- 25 Taft Ln
- 58 Chestnut St Unit 1
- 9 Wren Ct
- 60 Chestnut St Unit 2
- 86 Chestnut St
- 15 Woodland Ave
- 80 Western Ave
- 320 South St Unit F
- 320 South St Unit E
- 53 James St
- 57 James St
- 51 James St
- 21 B Green St Aka 9 Green St Unit B
- 47 James St
- 9 Green St
- 9 Green St
- 9 Green St Unit 21A
- 9 Green St Unit B
- 61 James St
- 60 Madison St
- 58 Madison St
- 70 James St
- 56 Madison St
- 66 James St
- 101.5 Macculloch Ave
- 74 James St
- 43 James St
- 101 1/2 Macculloch Ave
- 99 Macculloch Ave