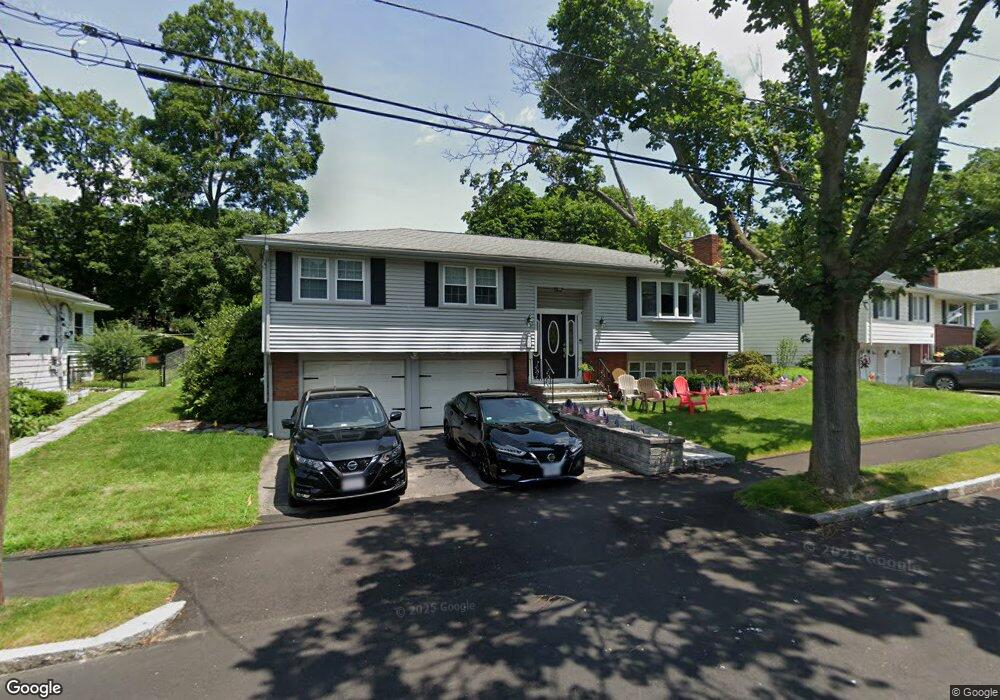
55 Joan Dr Quincy, MA 02169
Quincy Center NeighborhoodEstimated Value: $771,367 - $886,000
3
Beds
3
Baths
1,384
Sq Ft
$612/Sq Ft
Est. Value
About This Home
This home is located at 55 Joan Dr, Quincy, MA 02169 and is currently estimated at $847,092, approximately $612 per square foot. 55 Joan Dr is a home located in Norfolk County with nearby schools including Charles A. Bernazzani Elementary School, Central Middle School, and Quincy High School.
Ownership History
Date
Name
Owned For
Owner Type
Purchase Details
Closed on
Jun 9, 2020
Sold by
Billikas William N and Billikas Linda M
Bought by
Billikas Ret
Current Estimated Value
Purchase Details
Closed on
Jul 26, 1991
Sold by
Roberts Elaine R
Bought by
Billikas William N and Linda M Billikas
Home Financials for this Owner
Home Financials are based on the most recent Mortgage that was taken out on this home.
Original Mortgage
$166,900
Interest Rate
9.58%
Mortgage Type
Purchase Money Mortgage
Purchase Details
Closed on
Dec 12, 1990
Sold by
Stern Aaron
Bought by
Roberts Elaine R
Create a Home Valuation Report for This Property
The Home Valuation Report is an in-depth analysis detailing your home's value as well as a comparison with similar homes in the area
Home Values in the Area
Average Home Value in this Area
Purchase History
| Date | Buyer | Sale Price | Title Company |
|---|---|---|---|
| Billikas Ret | -- | None Available | |
| Billikas William N | $193,900 | -- | |
| Roberts Elaine R | $20,000 | -- |
Source: Public Records
Mortgage History
| Date | Status | Borrower | Loan Amount |
|---|---|---|---|
| Previous Owner | Roberts Elaine R | $163,000 | |
| Previous Owner | Roberts Elaine R | $166,900 |
Source: Public Records
Tax History
| Year | Tax Paid | Tax Assessment Tax Assessment Total Assessment is a certain percentage of the fair market value that is determined by local assessors to be the total taxable value of land and additions on the property. | Land | Improvement |
|---|---|---|---|---|
| 2025 | $7,676 | $665,700 | $309,900 | $355,800 |
| 2024 | $7,234 | $641,900 | $295,300 | $346,600 |
| 2023 | $6,526 | $586,300 | $268,700 | $317,600 |
| 2022 | $6,585 | $549,700 | $244,500 | $305,200 |
| 2021 | $6,353 | $523,300 | $244,500 | $278,800 |
| 2020 | $5,871 | $472,300 | $232,900 | $239,400 |
| 2019 | $5,749 | $458,100 | $219,900 | $238,200 |
| 2018 | $6,048 | $453,400 | $219,900 | $233,500 |
| 2017 | $5,783 | $408,100 | $209,600 | $198,500 |
| 2016 | $5,394 | $375,600 | $199,700 | $175,900 |
| 2015 | $5,368 | $367,700 | $199,700 | $168,000 |
| 2014 | $5,127 | $345,000 | $190,300 | $154,700 |
Source: Public Records
Map
Nearby Homes
- 1 Cityview Ln Unit 506
- 1 Cityview Ln Unit 709
- 1 Cityview Ln Unit 707
- 72 Oakland Ave
- 40 Cross St Unit 1
- 10 Presidents Ln Unit 10
- 46 Suomi Rd Unit 46
- 46 Suomi Rd
- 12 Nelson St
- 211 Copeland St
- 230 Willard St Unit 102
- 41 Wallace Rd
- 22 Newton Ave
- 1025 Hancock St Unit 6J
- 1025 Hancock St Unit 2K
- 281 Elmwood Ave
- 114 Willard St Unit 4
- 57 Buckley St
- 14 Arthur Ave
- 59 Packards Ln Unit 5
Your Personal Tour Guide
Ask me questions while you tour the home.