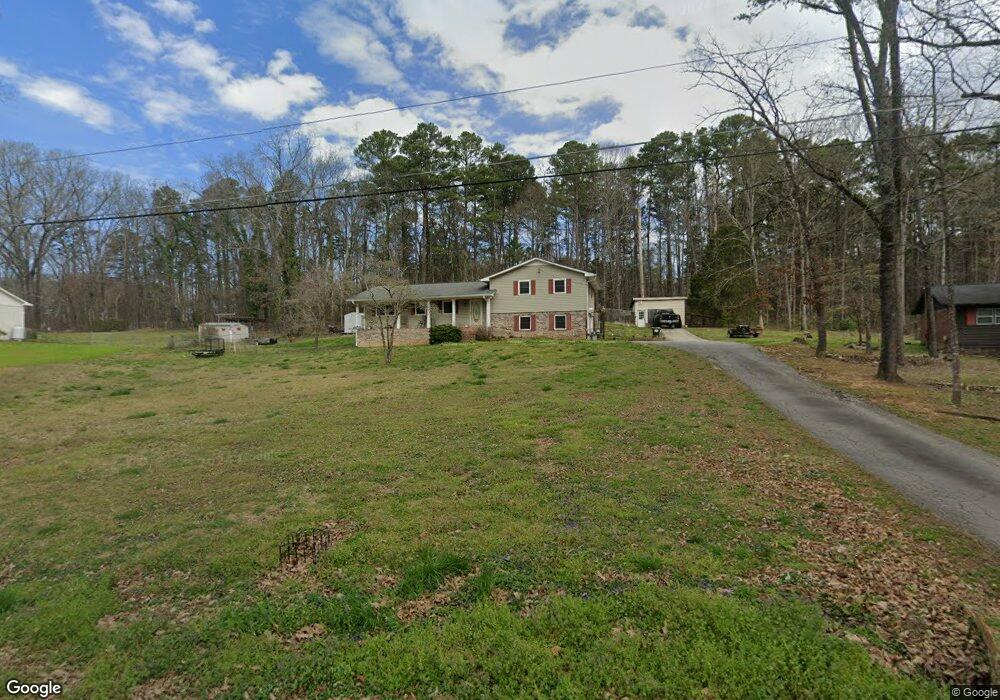
55 Johnson Cir Cedartown, GA 30125
Estimated Value: $251,000 - $272,000
3
Beds
2
Baths
1,584
Sq Ft
$163/Sq Ft
Est. Value
About This Home
This home is located at 55 Johnson Cir, Cedartown, GA 30125 and is currently estimated at $258,249, approximately $163 per square foot. 55 Johnson Cir is a home located in Polk County with nearby schools including Cedar Christian School.
Ownership History
Date
Name
Owned For
Owner Type
Purchase Details
Closed on
Feb 20, 1996
Sold by
Guice David and Guice Lorrie
Bought by
Ledbetter Kimberly L
Current Estimated Value
Purchase Details
Closed on
Jun 8, 1988
Sold by
Weaver Terry
Bought by
Guice David and Guice Lorrie
Purchase Details
Closed on
Oct 28, 1978
Sold by
Knight W J
Bought by
Weaver Terry
Purchase Details
Closed on
May 10, 1977
Sold by
Wright Ronald Gary
Bought by
Knight W J
Purchase Details
Closed on
Nov 8, 1975
Sold by
1St Fed Sav & Loan
Bought by
Wright Ronald Gary
Purchase Details
Closed on
Aug 17, 1973
Sold by
Baxter Jerry Build I
Bought by
Ridgeway Larry
Purchase Details
Closed on
Jan 1, 1971
Sold by
Lynn Gammage Ltd
Bought by
Anderson Joseph N
Purchase Details
Closed on
Sep 21, 1970
Sold by
Norris Donald G
Bought by
Lynn Gammage Ltd
Purchase Details
Closed on
Apr 2, 1968
Bought by
Norris Donald G
Create a Home Valuation Report for This Property
The Home Valuation Report is an in-depth analysis detailing your home's value as well as a comparison with similar homes in the area
Home Values in the Area
Average Home Value in this Area
Purchase History
| Date | Buyer | Sale Price | Title Company |
|---|---|---|---|
| Ledbetter Kimberly L | $65,000 | -- | |
| Guice David | $55,000 | -- | |
| Weaver Terry | -- | -- | |
| Knight W J | -- | -- | |
| Wright Ronald Gary | -- | -- | |
| 1St Fed Sav & Loan | -- | -- | |
| Ridgeway Larry | -- | -- | |
| Baxter Jerry Build I | -- | -- | |
| Anderson Joseph N | -- | -- | |
| Lynn Gammage Ltd | -- | -- | |
| Norris Donald G | -- | -- |
Source: Public Records
Tax History Compared to Growth
Tax History
| Year | Tax Paid | Tax Assessment Tax Assessment Total Assessment is a certain percentage of the fair market value that is determined by local assessors to be the total taxable value of land and additions on the property. | Land | Improvement |
|---|---|---|---|---|
| 2024 | $1,720 | $84,280 | $10,000 | $74,280 |
| 2023 | $1,238 | $54,165 | $4,000 | $50,165 |
| 2022 | $1,095 | $48,123 | $4,000 | $44,123 |
| 2021 | $1,109 | $48,123 | $4,000 | $44,123 |
| 2020 | $1,111 | $48,123 | $4,000 | $44,123 |
| 2019 | $970 | $38,115 | $2,600 | $35,515 |
| 2018 | $936 | $35,957 | $2,600 | $33,357 |
| 2017 | $924 | $35,957 | $2,600 | $33,357 |
| 2016 | $924 | $35,957 | $2,600 | $33,357 |
| 2015 | $930 | $36,081 | $2,600 | $33,481 |
| 2014 | $927 | $35,728 | $2,247 | $33,481 |
Source: Public Records
Map
Nearby Homes
- 766 Antioch Rd
- 480 Cason Rd
- 255 Mildred Dr
- 35 Old Mill Rd
- 1987 Buchanan Hwy
- 203 Cason Rd
- 00 Buchanan Hwy
- 95 Wieuca Way
- 240 Benedict Loop
- 117 Cason Rd
- 142 Acres On Judkin Mill Rd
- 000 Wieuca Way
- 0 Wieuca Way Unit 10614129
- 205 Pinecrest Rd
- 149 Irwin St
- 0 Philpot Springs Unit 10626665
- 0 Coaling Rd Unit 9221-D 10352096
- 0 Coaling Rd Unit 9221-C 10352086
- 0 Coaling Rd Unit 9221 10352063
- 0 Coaling Rd Unit 9221-B 10352079