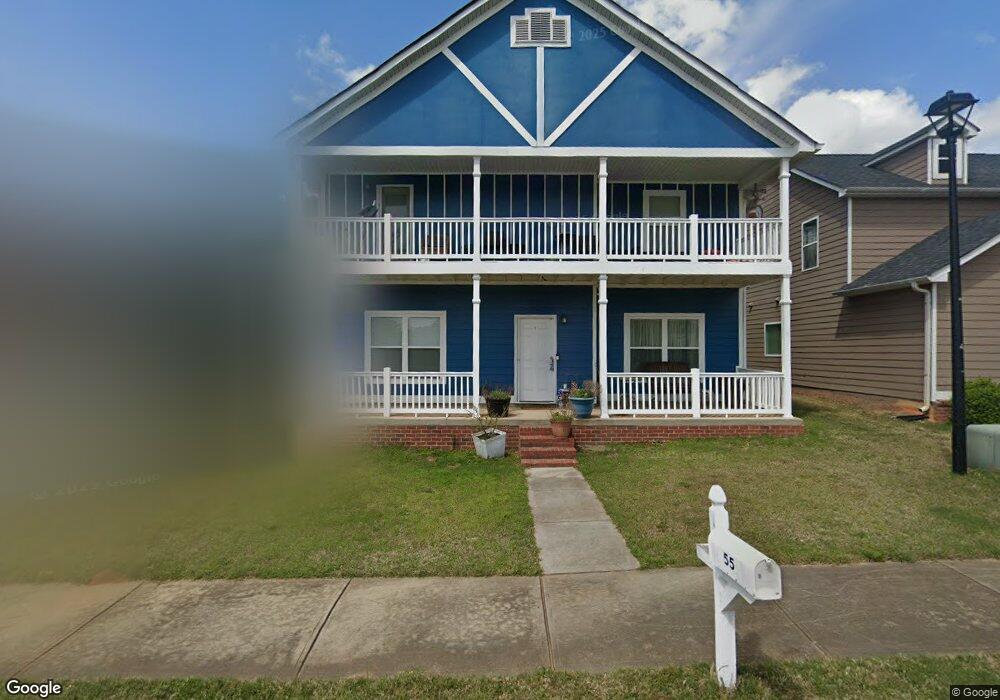
55 Kevin Ct Porterdale, GA 30014
Estimated Value: $272,000 - $304,000
--
Bed
2
Baths
2,264
Sq Ft
$126/Sq Ft
Est. Value
About This Home
This home is located at 55 Kevin Ct, Porterdale, GA 30014 and is currently estimated at $285,704, approximately $126 per square foot. 55 Kevin Ct is a home located in Newton County with nearby schools including South Salem Elementary School, Liberty Middle School, and Alcovy High School.
Ownership History
Date
Name
Owned For
Owner Type
Purchase Details
Closed on
Jul 24, 2023
Sold by
Johnson Brian Kenneth
Bought by
Johnson Damiale
Current Estimated Value
Purchase Details
Closed on
Jul 19, 2018
Sold by
Singleton Thomas M
Bought by
Johnson Brian Kenneth and Johnson Damiale N
Purchase Details
Closed on
Sep 6, 2016
Sold by
James W
Bought by
Singleton Thomas M
Purchase Details
Closed on
Feb 27, 2013
Sold by
Singleton Thomas M
Bought by
Sasser James W and Sasser Sonia A
Home Financials for this Owner
Home Financials are based on the most recent Mortgage that was taken out on this home.
Original Mortgage
$92,700
Interest Rate
3.56%
Mortgage Type
New Conventional
Purchase Details
Closed on
Jul 17, 2008
Sold by
Southern Community Bank
Bought by
Singleton Thomas M
Home Financials for this Owner
Home Financials are based on the most recent Mortgage that was taken out on this home.
Original Mortgage
$92,700
Interest Rate
6.43%
Mortgage Type
New Conventional
Purchase Details
Closed on
Mar 4, 2008
Sold by
Integra Hms Llc
Bought by
Southern Cmnty Bk
Create a Home Valuation Report for This Property
The Home Valuation Report is an in-depth analysis detailing your home's value as well as a comparison with similar homes in the area
Home Values in the Area
Average Home Value in this Area
Purchase History
| Date | Buyer | Sale Price | Title Company |
|---|---|---|---|
| Johnson Damiale | -- | -- | |
| Johnson Brian Kenneth | $162,000 | -- | |
| Singleton Thomas M | -- | -- | |
| Sasser James W | $139,000 | -- | |
| Singleton Thomas M | $103,000 | -- | |
| Southern Cmnty Bk | $460,000 | -- |
Source: Public Records
Mortgage History
| Date | Status | Borrower | Loan Amount |
|---|---|---|---|
| Previous Owner | Sasser James W | $92,700 | |
| Previous Owner | Singleton Thomas M | $92,700 |
Source: Public Records
Tax History Compared to Growth
Tax History
| Year | Tax Paid | Tax Assessment Tax Assessment Total Assessment is a certain percentage of the fair market value that is determined by local assessors to be the total taxable value of land and additions on the property. | Land | Improvement |
|---|---|---|---|---|
| 2024 | $3,838 | $103,880 | $16,400 | $87,480 |
| 2023 | $3,177 | $83,200 | $8,000 | $75,200 |
| 2022 | $2,881 | $76,000 | $8,000 | $68,000 |
| 2021 | $3,062 | $74,800 | $8,000 | $66,800 |
| 2020 | $2,088 | $66,040 | $8,000 | $58,040 |
| 2019 | $1,910 | $59,880 | $8,000 | $51,880 |
| 2018 | $1,939 | $56,480 | $7,200 | $49,280 |
| 2017 | $1,349 | $39,280 | $4,800 | $34,480 |
| 2016 | $1,187 | $38,480 | $4,000 | $34,480 |
| 2015 | $1,077 | $35,280 | $4,000 | $31,280 |
| 2014 | $940 | $31,320 | $0 | $0 |
Source: Public Records
Map
Nearby Homes
- 45 Kevin Ct
- 65 Kevin Ct
- 0 Kevin Ct Unit 8004276
- 0 Kevin Ct Unit 7068130
- 75 Kevin Ct Unit 9
- 75 Kevin Ct
- 35 Kevin Ct Unit 14
- 25 Kevin Ct
- 0 Kevin Ct Unit 3260661
- 100 Austin Terrace
- 50 Kevin Ct
- 70 Kevin Ct
- 90 Austin Terrace
- 0 Austin Terrace Unit 3271507
- 0 Austin Terrace Unit 3271494
- 0 Austin Terrace Unit 7230469
- 0 Austin Terrace
- 15 Kevin Ct
- 80 Austin Terrace
- 105 Austin Terrace