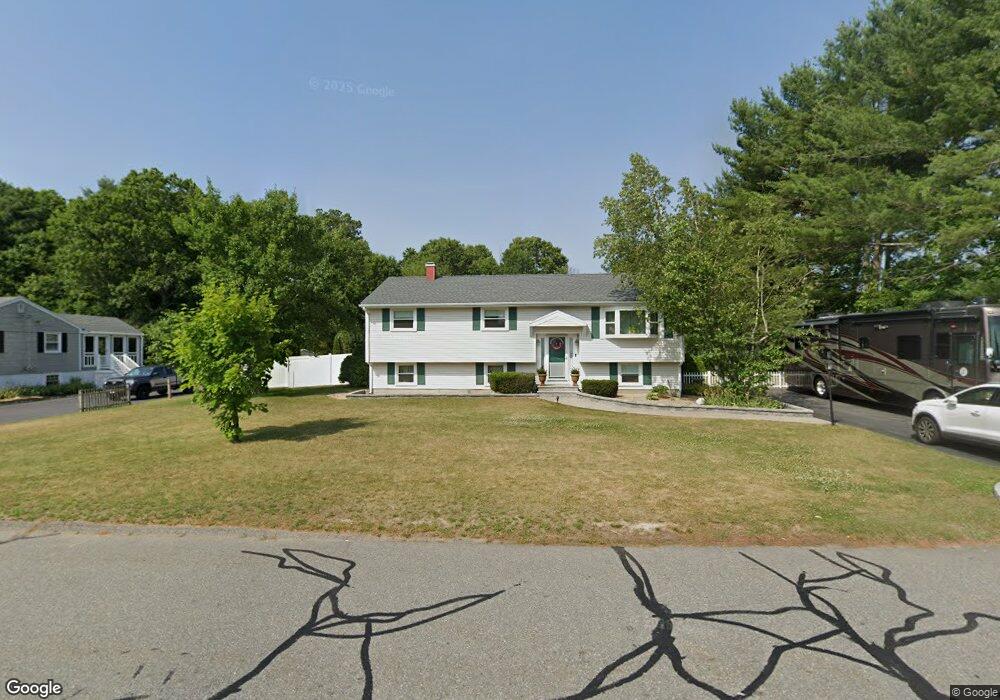
55 Lakeview Dr Raynham, MA 02767
Estimated Value: $577,831 - $609,000
3
Beds
1
Bath
1,598
Sq Ft
$369/Sq Ft
Est. Value
About This Home
This home is located at 55 Lakeview Dr, Raynham, MA 02767 and is currently estimated at $589,208, approximately $368 per square foot. 55 Lakeview Dr is a home located in Bristol County with nearby schools including Merrill Elementary School, LaLiberte Elementary School, and Williams Intermediate School.
Ownership History
Date
Name
Owned For
Owner Type
Purchase Details
Closed on
Mar 31, 1997
Sold by
Malloch Constr Co Inc
Bought by
Holt Timothy W and Gaffney Kathleen A
Current Estimated Value
Home Financials for this Owner
Home Financials are based on the most recent Mortgage that was taken out on this home.
Original Mortgage
$142,689
Interest Rate
7.59%
Mortgage Type
Purchase Money Mortgage
Create a Home Valuation Report for This Property
The Home Valuation Report is an in-depth analysis detailing your home's value as well as a comparison with similar homes in the area
Home Values in the Area
Average Home Value in this Area
Purchase History
| Date | Buyer | Sale Price | Title Company |
|---|---|---|---|
| Holt Timothy W | $146,000 | -- |
Source: Public Records
Mortgage History
| Date | Status | Borrower | Loan Amount |
|---|---|---|---|
| Open | Holt Timothy W | $110,000 | |
| Closed | Holt Timothy W | $142,119 | |
| Closed | Holt Timothy W | $142,689 |
Source: Public Records
Tax History Compared to Growth
Tax History
| Year | Tax Paid | Tax Assessment Tax Assessment Total Assessment is a certain percentage of the fair market value that is determined by local assessors to be the total taxable value of land and additions on the property. | Land | Improvement |
|---|---|---|---|---|
| 2025 | $5,951 | $491,800 | $216,000 | $275,800 |
| 2024 | $5,865 | $472,200 | $196,400 | $275,800 |
| 2023 | $5,265 | $387,100 | $176,700 | $210,400 |
| 2022 | $5,262 | $354,800 | $166,900 | $187,900 |
| 2021 | $4,964 | $337,900 | $157,100 | $180,800 |
| 2020 | $4,672 | $324,200 | $149,200 | $175,000 |
| 2019 | $4,474 | $314,400 | $139,400 | $175,000 |
| 2018 | $4,171 | $279,900 | $131,600 | $148,300 |
| 2017 | $3,920 | $260,800 | $125,700 | $135,100 |
| 2016 | $3,848 | $256,900 | $121,800 | $135,100 |
| 2015 | $3,606 | $236,600 | $126,300 | $110,300 |
Source: Public Records
Map
Nearby Homes
- 84 Diniz Dr
- 2 Maplewood Ln Unit 21-1
- 0 Maplewood Unit 21.3 73426136
- 0 Maplewood Unit 33-1 73420094
- 73 Sherwood Ln
- 970 N Main St
- 123 Center St
- 21 Sully Rd
- 30 Edward Rd
- 271 King St
- 53 Queens Cir
- 52 Ward St
- 658 Broadway
- 79 Jennings Dr
- 138 Carver St
- 930 King St
- 152 Forgeriver
- 38 Elm St E
- 65 Lothrop St
- 5 New Carver St