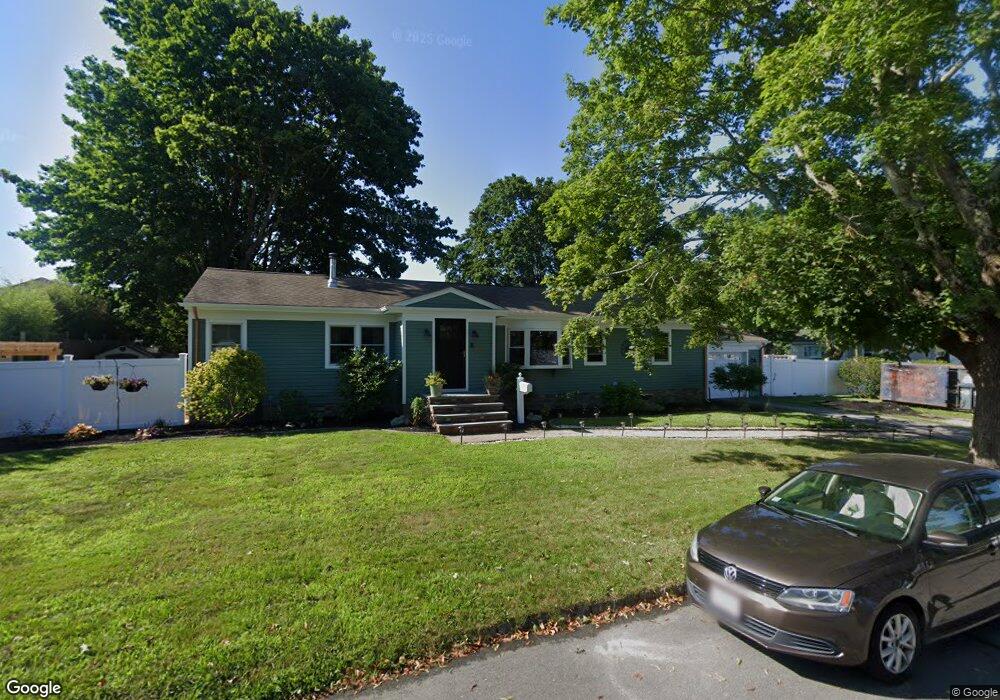
55 Linden Ave Fairhaven, MA 02719
Oxford NeighborhoodEstimated Value: $434,000 - $561,000
4
Beds
2
Baths
1,704
Sq Ft
$305/Sq Ft
Est. Value
About This Home
This home is located at 55 Linden Ave, Fairhaven, MA 02719 and is currently estimated at $519,105, approximately $304 per square foot. 55 Linden Ave is a home located in Bristol County with nearby schools including Fairhaven High School, City On A Hill Charter Public School New Bedford, and St. Joseph School.
Ownership History
Date
Name
Owned For
Owner Type
Purchase Details
Closed on
Jan 14, 2002
Sold by
Melanson Cathy J and Santos Michael J
Bought by
Correia Melanson-Correia C and Correia Dennis M
Current Estimated Value
Home Financials for this Owner
Home Financials are based on the most recent Mortgage that was taken out on this home.
Original Mortgage
$105,000
Interest Rate
7.04%
Mortgage Type
Purchase Money Mortgage
Create a Home Valuation Report for This Property
The Home Valuation Report is an in-depth analysis detailing your home's value as well as a comparison with similar homes in the area
Home Values in the Area
Average Home Value in this Area
Purchase History
| Date | Buyer | Sale Price | Title Company |
|---|---|---|---|
| Correia Melanson-Correia C | $140,000 | -- |
Source: Public Records
Mortgage History
| Date | Status | Borrower | Loan Amount |
|---|---|---|---|
| Open | Correia Melanson-Correia C | $106,000 | |
| Closed | Correia Melanson-Correia C | $105,000 | |
| Previous Owner | Correia Melanson-Correia C | $58,000 | |
| Previous Owner | Correia Melanson-Correia C | $10,000 |
Source: Public Records
Tax History
| Year | Tax Paid | Tax Assessment Tax Assessment Total Assessment is a certain percentage of the fair market value that is determined by local assessors to be the total taxable value of land and additions on the property. | Land | Improvement |
|---|---|---|---|---|
| 2025 | $41 | $443,500 | $179,200 | $264,300 |
| 2024 | $3,799 | $411,600 | $179,200 | $232,400 |
| 2023 | $3,631 | $364,900 | $157,000 | $207,900 |
| 2022 | $3,428 | $335,400 | $145,900 | $189,500 |
| 2021 | $3,245 | $287,400 | $132,000 | $155,400 |
| 2020 | $4,920 | $287,400 | $132,000 | $155,400 |
| 2019 | $3,052 | $261,500 | $109,500 | $152,000 |
| 2018 | $2,923 | $248,800 | $104,300 | $144,500 |
| 2017 | $2,922 | $242,700 | $104,300 | $138,400 |
| 2016 | $2,873 | $235,900 | $104,300 | $131,600 |
| 2015 | $2,861 | $235,500 | $104,300 | $131,200 |
Source: Public Records
Map
Nearby Homes