NOT LISTED FOR SALE

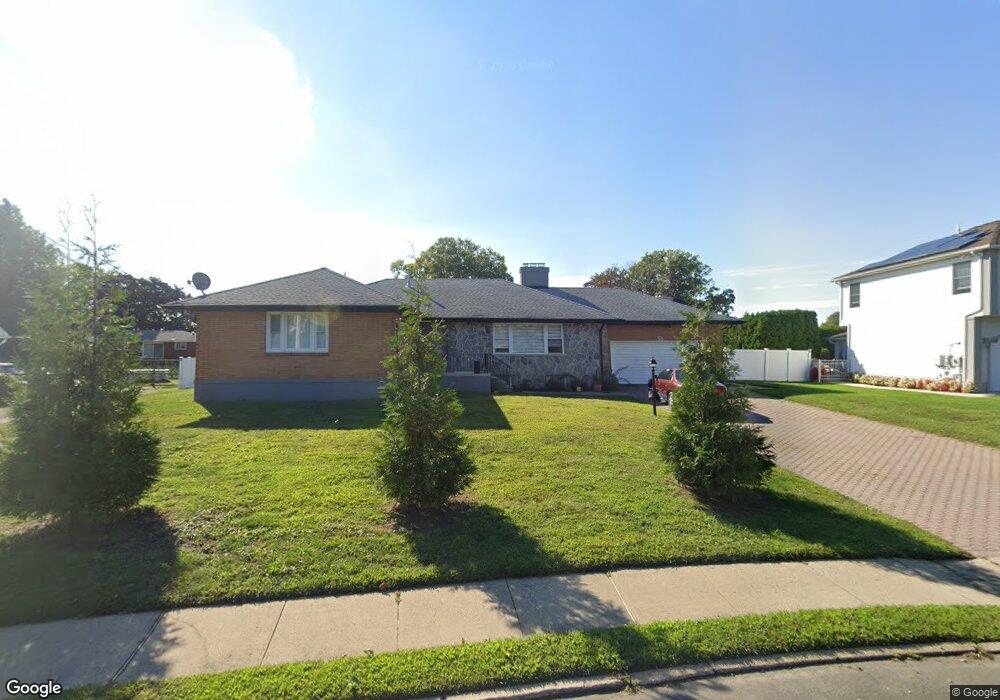
55 Locust Ave Unit Summer West Long Branch, NJ 07764

Estimated Value: $955,000 - $1,095,000

4 Beds
4 Baths
2,728 Sq Ft
$386/Sq Ft Est. Value

About This Home

This home is located at 55 Locust Ave Unit Summer, West Long Branch, NJ 07764 and is currently estimated at $1,053,884, approximately $386 per square foot. 55 Locust Ave Unit Summer is a home located in Monmouth County with nearby schools including Betty McElmon Elementary School, Frank Antonides School, and Shore Regional High School.

Ownership History

Date Name Owned For Owner Type

Purchase Details

Closed on
May 26, 2022
Sold by
Serebreny and Carolyn
Bought by
Avraham Daniel
Current Estimated Value
$1,053,884

Home Financials for this Owner

Home Financials are based on the most recent Mortgage that was taken out on this home.
Original Mortgage
$455,000
Outstanding Balance
$435,111
Interest Rate
4.63%
Mortgage Type
New Conventional
Estimated Equity
$578,772

Purchase Details

Closed on
Mar 5, 2012
Sold by
Serebreny Raphael and Serebreny Carolyn
Bought by
Serebreny Raphael

Home Financials for this Owner

Home Financials are based on the most recent Mortgage that was taken out on this home.
Original Mortgage
$592,500
Interest Rate
3.89%
Mortgage Type
Reverse Mortgage Home Equity Conversion Mortgage

Purchase Details

Closed on
Aug 29, 2006
Sold by
Gemignani Louis
Bought by
Serebreny Raphael and Serebreny Carolyn

Range of Values:

Collateral Analytics

Collateral Analytics Collateral Analytics AVMs (Automated Valuation Model) employ a number of statistical approaches combined with neighborhood-specific comparable selection guarantees the most up-to-date and precise valuations.

Not Available

Collateral Analytics does not have data for the current month. Please view the chart for historical values.

ICE

ICE Mortgage Technology ICE Mortgage Technology’s AVM (Automated Valuation Model) is a state-of-the-art online residential property valuation tool that provides a quick and accurate estimate of the value of almost any home in the U.S.

Not Available

ICE Mortgage Technology does not have data for the current month. Please view the chart for historical values.

First American

First American First American Data & Analytics’ next-generation AVM combines unrivaled data assets with a blended ensemble of valuation models to produce highly accurate, reliable valuations you can trust.

Not Available

First American does not have data for the current month. Please view the chart for historical values.

Quantarium

Quantarium Quantarium’s valuation service, repeatedly proven the industry’s most accurate and comprehensive, is supercharged with a self-learning and auto-tuning AI engine that continually becomes smarter and more accurate as it processes daily inputs from the industry’s leading RE data lake.

Not Available

Quantarium does not have data for the current month. Please view the chart for historical values.

Average Value
Not Available
List Price
Sold Price
Create a Home Valuation Report for This Property
The Home Valuation Report is an in-depth analysis detailing your home's value as well as a comparison with similar homes in the area

Home Values in the Area

Source: Public Records

Average Home Value in this Area


Source: Public Records

Purchase History

Date Buyer Sale Price Title Company
Avraham Daniel $800,000 Mega Title
Serebreny Raphael -- None Available
Serebreny Raphael $575,000 --
Source: Public Records

Mortgage History

Date Status Borrower Loan Amount
Open Avraham Daniel $455,000
Previous Owner Serebreny Raphael $592,500
Source: Public Records

Tax History Compared to Growth

Source: Public Records

Tax History

Year Tax Paid Tax Assessment Tax Assessment Total Assessment is a certain percentage of the fair market value that is determined by local assessors to be the total taxable value of land and additions on the property. Land Improvement
2024 $10,954 $1,060,200 $407,700 $652,500
2023 $10,954 $784,100 $321,800 $462,300
2022 $9,606 $691,900 $254,300 $437,600
2021 $9,606 $547,000 $190,600 $356,400
2020 $10,836 $527,300 $179,000 $348,300
2019 $10,647 $520,900 $176,400 $344,500
2018 $10,682 $504,800 $176,400 $328,400
2017 $10,963 $494,700 $176,400 $318,300
2016 $10,788 $496,700 $209,300 $287,400
2015 $10,958 $503,800 $209,300 $294,500
2014 $10,480 $449,600 $168,800 $280,800
Source: Public Records

Map