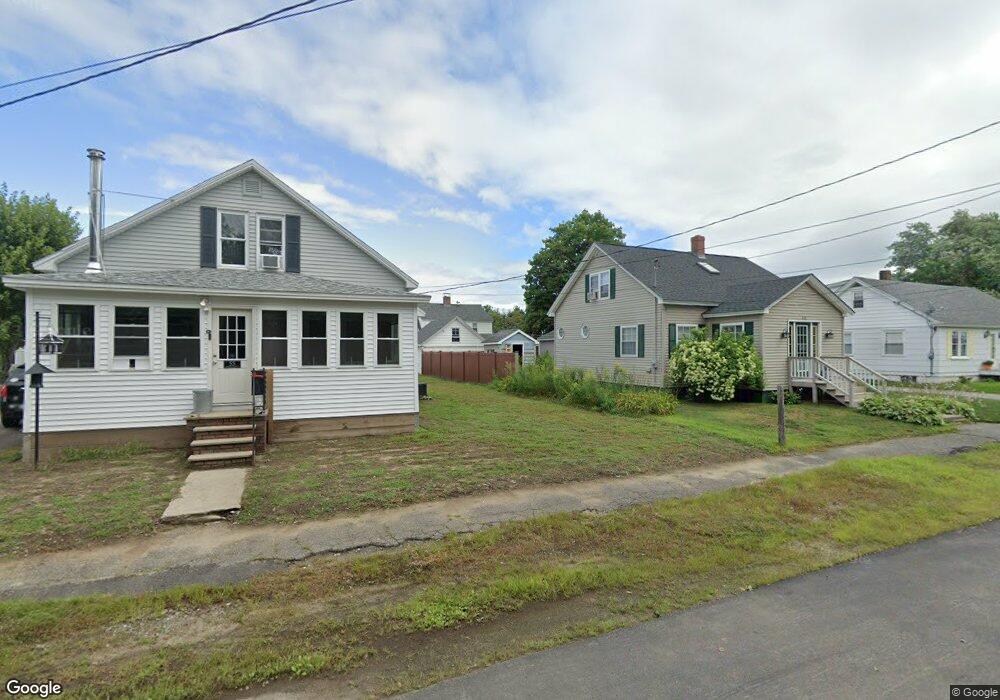
55 Maple St Millinocket, ME 04462
Estimated Value: $140,672 - $202,000
Studio
--
Bath
--
Sq Ft
6,098
Sq Ft Lot
About This Home
This home is located at 55 Maple St, Millinocket, ME 04462 and is currently estimated at $164,418. 55 Maple St is a home with nearby schools including Granite Street School and Stearns Junior/Senior High School.
Ownership History
Date
Name
Owned For
Owner Type
Purchase Details
Closed on
Dec 12, 2023
Sold by
Rands Quality Eggs
Bought by
Rand David
Current Estimated Value
Home Financials for this Owner
Home Financials are based on the most recent Mortgage that was taken out on this home.
Original Mortgage
$53,840
Outstanding Balance
$52,908
Interest Rate
7.79%
Mortgage Type
Credit Line Revolving
Estimated Equity
$111,510
Purchase Details
Closed on
Jan 13, 2017
Sold by
Bradbury Alfred G
Bought by
Bradbury Alfred G and Martin Susan
Create a Home Valuation Report for This Property
The Home Valuation Report is an in-depth analysis detailing your home's value as well as a comparison with similar homes in the area
Home Values in the Area
Average Home Value in this Area
Purchase History
| Date | Buyer | Sale Price | Title Company |
|---|---|---|---|
| Rand David | -- | None Available | |
| Rand David | -- | None Available | |
| Bradbury Alfred G | -- | -- | |
| Bradbury Alfred G | -- | -- |
Source: Public Records
Mortgage History
| Date | Status | Borrower | Loan Amount |
|---|---|---|---|
| Open | Rand David | $53,840 |
Source: Public Records
Tax History Compared to Growth
Tax History
| Year | Tax Paid | Tax Assessment Tax Assessment Total Assessment is a certain percentage of the fair market value that is determined by local assessors to be the total taxable value of land and additions on the property. | Land | Improvement |
|---|---|---|---|---|
| 2025 | $2,289 | $99,500 | $7,200 | $92,300 |
| 2024 | $2,296 | $83,200 | $3,600 | $79,600 |
| 2023 | $1,898 | $67,300 | $3,600 | $63,700 |
| 2022 | $1,770 | $60,000 | $3,600 | $56,400 |
| 2021 | $1,784 | $54,900 | $3,600 | $51,300 |
| 2020 | $1,768 | $52,000 | $3,600 | $48,400 |
| 2019 | $1,716 | $52,000 | $3,600 | $48,400 |
| 2018 | $1,690 | $52,000 | $3,600 | $48,400 |
| 2017 | $1,680 | $52,000 | $3,600 | $48,400 |
| 2016 | $1,628 | $52,000 | $3,600 | $48,400 |
| 2015 | $1,542 | $52,000 | $3,600 | $48,400 |
| 2014 | $1,539 | $52,000 | $3,600 | $48,400 |
Source: Public Records
Map
Nearby Homes