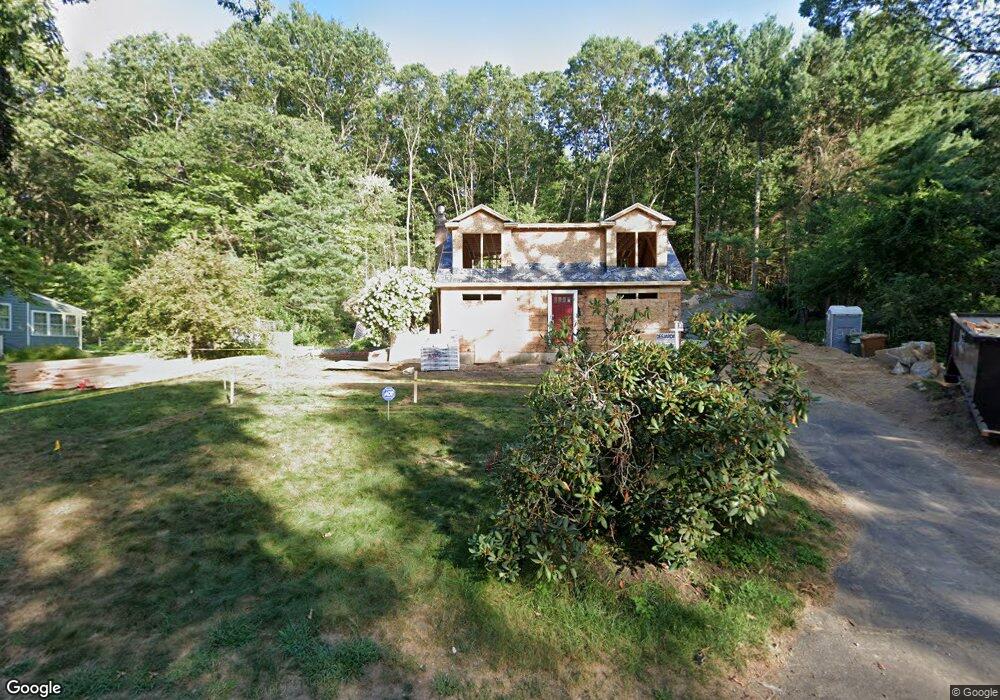
55 Moore Rd Wayland, MA 01778
Estimated Value: $984,000 - $1,479,000
3
Beds
2
Baths
1,328
Sq Ft
$965/Sq Ft
Est. Value
About This Home
This home is located at 55 Moore Rd, Wayland, MA 01778 and is currently estimated at $1,281,765, approximately $965 per square foot. 55 Moore Rd is a home located in Middlesex County with nearby schools including Wayland High School.
Ownership History
Date
Name
Owned For
Owner Type
Purchase Details
Closed on
Nov 5, 2024
Sold by
Ventress Perrin E and Ventress Zachariah L
Bought by
Perrin E Ventress Ret and Ventress
Current Estimated Value
Purchase Details
Closed on
Apr 28, 2008
Sold by
Blondin Dorothy E
Bought by
Ventress Perrin E and Ventress Zachariah L
Home Financials for this Owner
Home Financials are based on the most recent Mortgage that was taken out on this home.
Original Mortgage
$405,000
Interest Rate
6.22%
Mortgage Type
Purchase Money Mortgage
Create a Home Valuation Report for This Property
The Home Valuation Report is an in-depth analysis detailing your home's value as well as a comparison with similar homes in the area
Home Values in the Area
Average Home Value in this Area
Purchase History
| Date | Buyer | Sale Price | Title Company |
|---|---|---|---|
| Perrin E Ventress Ret | -- | None Available | |
| Perrin E Ventress Ret | -- | None Available | |
| Ventress Perrin E | $485,000 | -- | |
| Ventress Perrin E | $485,000 | -- |
Source: Public Records
Mortgage History
| Date | Status | Borrower | Loan Amount |
|---|---|---|---|
| Previous Owner | Ventress Perrin E | $393,000 | |
| Previous Owner | Ventress Perrin E | $405,000 |
Source: Public Records
Tax History
| Year | Tax Paid | Tax Assessment Tax Assessment Total Assessment is a certain percentage of the fair market value that is determined by local assessors to be the total taxable value of land and additions on the property. | Land | Improvement |
|---|---|---|---|---|
| 2025 | $20,167 | $1,290,300 | $571,000 | $719,300 |
| 2024 | $19,062 | $1,228,200 | $543,800 | $684,400 |
| 2023 | $18,696 | $1,122,900 | $494,200 | $628,700 |
| 2022 | $17,867 | $973,700 | $409,200 | $564,500 |
| 2021 | $17,346 | $936,600 | $372,100 | $564,500 |
| 2020 | $14,503 | $816,600 | $372,100 | $444,500 |
| 2019 | $10,056 | $550,100 | $354,500 | $195,600 |
| 2018 | $228,774 | $531,200 | $354,500 | $176,700 |
| 2017 | $9,391 | $517,700 | $343,700 | $174,000 |
| 2016 | $8,540 | $492,500 | $336,800 | $155,700 |
| 2015 | $8,884 | $483,100 | $336,800 | $146,300 |
Source: Public Records
Map
Nearby Homes
- 55 Sherman's Bridge Rd
- 17 Glezen Ln
- 93 Draper Rd
- 63 Claypit Hill Rd
- 32 Highland Cir
- 291 Concord Rd
- 2 Old Sudbury Rd
- 93 Old Sudbury Rd
- 63 Sudbury Rd
- 1 Winthrop Terrace
- 141 Chestnut Cir Unit 141
- 156 Boston Post Rd
- 1B Quaboag Valley Co-Op St
- Lot 5 Sailaway Ln
- Lot 4 Sailaway Ln
- 2 Betts Way
- 8 Mina Way
- Lot 9 Sailaway Ln
- 35 Mt Alworth Rd
- 4 Betts Way
Your Personal Tour Guide
Ask me questions while you tour the home.