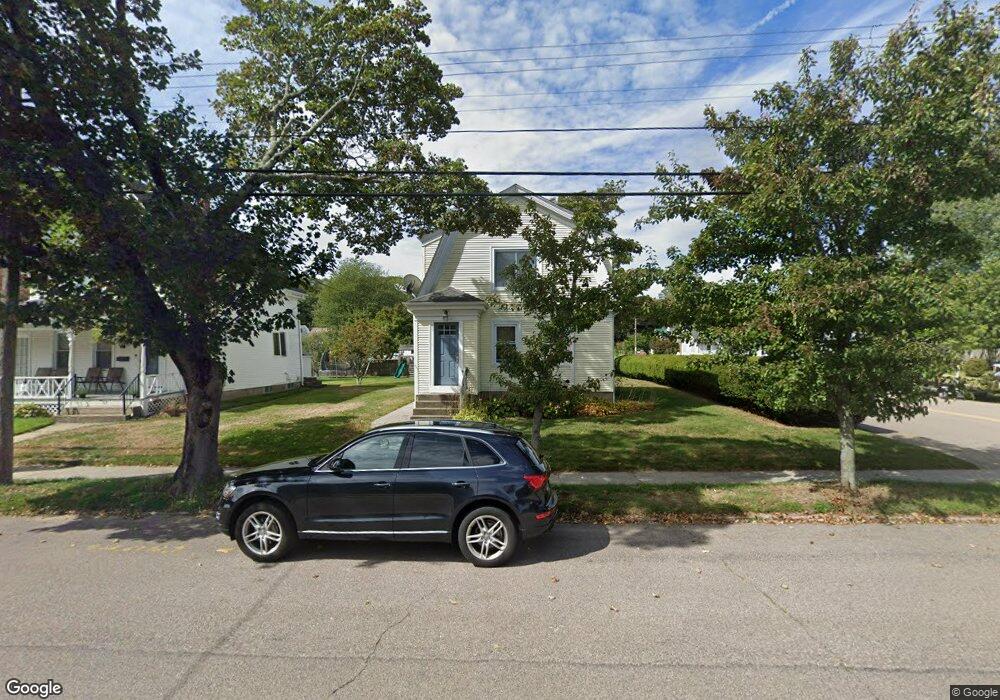
55 Moss St Pawcatuck, CT 06379
Estimated Value: $285,000 - $445,000
2
Beds
2
Baths
1,032
Sq Ft
$366/Sq Ft
Est. Value
About This Home
This home is located at 55 Moss St, Pawcatuck, CT 06379 and is currently estimated at $377,216, approximately $365 per square foot. 55 Moss St is a home located in New London County with nearby schools including Stonington Middle School, Stonington High School, and Pine Point School.
Ownership History
Date
Name
Owned For
Owner Type
Purchase Details
Closed on
Oct 2, 1992
Sold by
Steadman Richard
Bought by
Mendonca Joseph
Current Estimated Value
Home Financials for this Owner
Home Financials are based on the most recent Mortgage that was taken out on this home.
Original Mortgage
$88,650
Interest Rate
7.83%
Mortgage Type
Unknown
Create a Home Valuation Report for This Property
The Home Valuation Report is an in-depth analysis detailing your home's value as well as a comparison with similar homes in the area
Home Values in the Area
Average Home Value in this Area
Purchase History
| Date | Buyer | Sale Price | Title Company |
|---|---|---|---|
| Mendonca Joseph | $89,000 | -- | |
| Mendonca Joseph | $89,000 | -- |
Source: Public Records
Mortgage History
| Date | Status | Borrower | Loan Amount |
|---|---|---|---|
| Closed | Mendonca Joseph | $88,650 |
Source: Public Records
Tax History
| Year | Tax Paid | Tax Assessment Tax Assessment Total Assessment is a certain percentage of the fair market value that is determined by local assessors to be the total taxable value of land and additions on the property. | Land | Improvement |
|---|---|---|---|---|
| 2025 | $4,232 | $212,900 | $65,300 | $147,600 |
| 2024 | $4,056 | $212,900 | $65,300 | $147,600 |
| 2023 | $4,056 | $212,900 | $65,300 | $147,600 |
| 2022 | $3,503 | $136,800 | $54,000 | $82,800 |
| 2021 | $3,509 | $136,800 | $54,000 | $82,800 |
| 2020 | $3,442 | $136,800 | $54,000 | $82,800 |
| 2019 | $3,435 | $136,800 | $54,000 | $82,800 |
| 2018 | $3,319 | $136,800 | $54,000 | $82,800 |
| 2017 | $2,937 | $119,300 | $54,000 | $65,300 |
| 2016 | $2,857 | $119,300 | $54,000 | $65,300 |
| 2015 | $2,682 | $119,300 | $54,000 | $65,300 |
| 2014 | $2,529 | $115,000 | $54,000 | $61,000 |
Source: Public Records
Map
Nearby Homes
- 13 Palmer St
- 65 Mechanic St
- 15 Moss St
- 141 W Broad St
- 60 Margin St Unit 102
- 51 Pequot Trail
- 2 Pawcatuck Ave
- 25 School St Unit 2
- 16 Spring St
- 12 Canal St Unit 205
- 93 S Broad St
- 2 Gravity Ct
- 28 Spruce St
- 55 Pleasant St
- 19 Crestview Dr Unit C
- 23 Abbey Ln Unit 12
- 24 Abbey Ln Unit 13
- 21 Linden St
- 1 River St
- Lot 2, 770 Pequot Trail
Your Personal Tour Guide
Ask me questions while you tour the home.