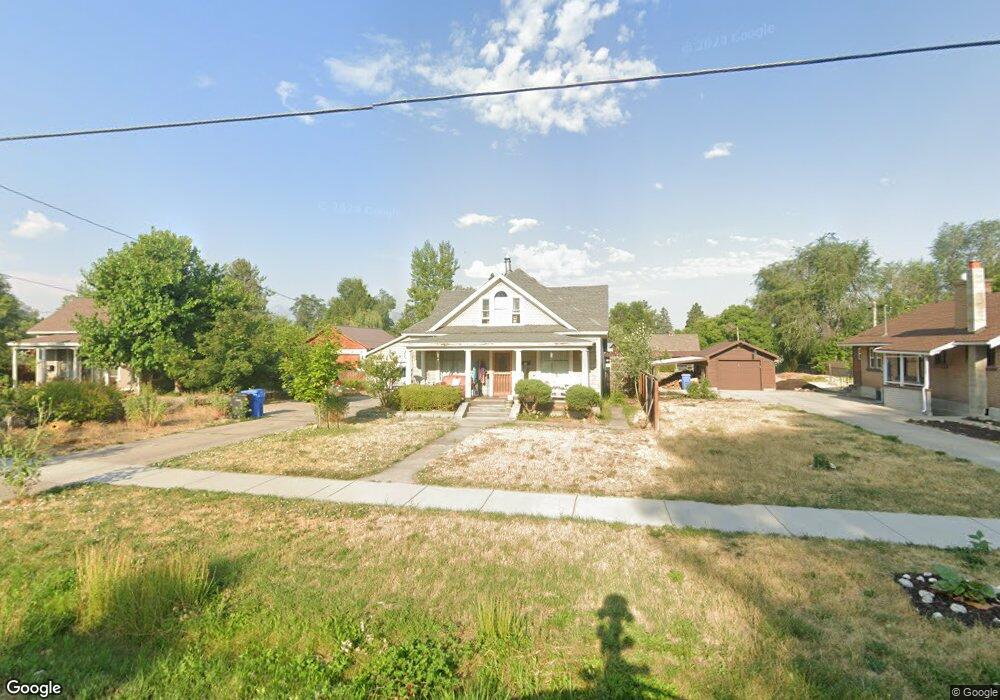
55 N 400 W Logan, UT 84321
Ellis NeighborhoodEstimated Value: $404,000 - $442,000
3
Beds
2
Baths
2,276
Sq Ft
$186/Sq Ft
Est. Value
About This Home
This home is located at 55 N 400 W, Logan, UT 84321 and is currently estimated at $424,436, approximately $186 per square foot. 55 N 400 W is a home located in Cache County with nearby schools including Ellis School, Mount Logan Middle School, and Logan High School.
Ownership History
Date
Name
Owned For
Owner Type
Purchase Details
Closed on
Mar 2, 2020
Sold by
Weed Charles T and Pagnucco Mary P
Bought by
Pagnucco Mary Paige and Weed Charles Toby
Current Estimated Value
Home Financials for this Owner
Home Financials are based on the most recent Mortgage that was taken out on this home.
Original Mortgage
$160,000
Outstanding Balance
$141,366
Interest Rate
3.6%
Mortgage Type
New Conventional
Estimated Equity
$283,070
Purchase Details
Closed on
Dec 26, 2001
Sold by
Black Jeffrey and Black Loretta K
Bought by
Williams Justin N and Williams Janice L
Home Financials for this Owner
Home Financials are based on the most recent Mortgage that was taken out on this home.
Original Mortgage
$109,250
Interest Rate
6.51%
Purchase Details
Closed on
Oct 23, 2001
Sold by
Kosta Scott R and Kosta Deborah M
Bought by
Black Jeffrey and Black Loretta K
Create a Home Valuation Report for This Property
The Home Valuation Report is an in-depth analysis detailing your home's value as well as a comparison with similar homes in the area
Home Values in the Area
Average Home Value in this Area
Purchase History
| Date | Buyer | Sale Price | Title Company |
|---|---|---|---|
| Pagnucco Mary Paige | -- | Cache Title Logan | |
| Williams Justin N | -- | -- | |
| Black Jeffrey | $87,560 | -- |
Source: Public Records
Mortgage History
| Date | Status | Borrower | Loan Amount |
|---|---|---|---|
| Open | Pagnucco Mary Paige | $160,000 | |
| Closed | Williams Justin N | $109,250 |
Source: Public Records
Tax History
| Year | Tax Paid | Tax Assessment Tax Assessment Total Assessment is a certain percentage of the fair market value that is determined by local assessors to be the total taxable value of land and additions on the property. | Land | Improvement |
|---|---|---|---|---|
| 2025 | $1,754 | $226,895 | $0 | $0 |
| 2024 | $1,802 | $225,745 | $0 | $0 |
| 2023 | $1,894 | $226,160 | $0 | $0 |
| 2022 | $1,912 | $213,140 | $0 | $0 |
| 2021 | $1,433 | $246,781 | $52,260 | $194,521 |
| 2020 | $1,302 | $201,892 | $52,260 | $149,632 |
| 2019 | $1,361 | $201,892 | $52,260 | $149,632 |
| 2018 | $1,372 | $185,860 | $52,260 | $133,600 |
| 2017 | $1,248 | $89,355 | $0 | $0 |
| 2016 | $1,294 | $83,850 | $0 | $0 |
| 2015 | $1,215 | $83,850 | $0 | $0 |
| 2014 | $1,099 | $83,850 | $0 | $0 |
| 2013 | -- | $83,850 | $0 | $0 |
Source: Public Records
Map
Nearby Homes
Your Personal Tour Guide
Ask me questions while you tour the home.