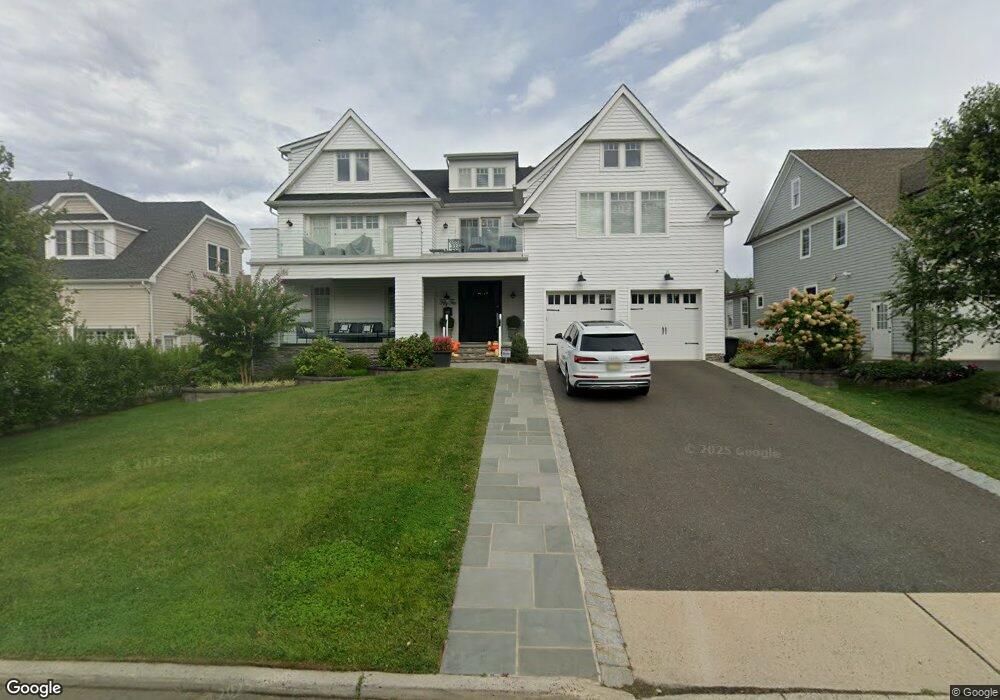
55 Navesink Dr Unit A Monmouth Beach, NJ 07750
Estimated Value: $2,433,000 - $3,160,000
5
Beds
5
Baths
5,099
Sq Ft
$569/Sq Ft
Est. Value
About This Home
This home is located at 55 Navesink Dr Unit A, Monmouth Beach, NJ 07750 and is currently estimated at $2,902,970, approximately $569 per square foot. 55 Navesink Dr Unit A is a home located in Monmouth County with nearby schools including Monmouth Beach School District, Shore Regional High School, and Holy Trinity School.
Ownership History
Date
Name
Owned For
Owner Type
Purchase Details
Closed on
Feb 11, 2021
Sold by
Leunes Paul and Leunes Marybeth
Bought by
Anderson J Scott J and Anderson Lora
Current Estimated Value
Home Financials for this Owner
Home Financials are based on the most recent Mortgage that was taken out on this home.
Original Mortgage
$750,000
Outstanding Balance
$670,793
Interest Rate
2.7%
Mortgage Type
New Conventional
Estimated Equity
$2,232,177
Purchase Details
Closed on
Aug 26, 2016
Sold by
Drive Jv Navesink
Bought by
Leunes Paul and Leunes Marybeth
Purchase Details
Closed on
Mar 14, 2016
Sold by
Drive Jv Navesink
Bought by
Waldron Gerard and Waldron Deborah
Purchase Details
Closed on
Jun 14, 2013
Sold by
Trotta Michael and Trotta Sharon
Bought by
Navesink Drive J V
Home Financials for this Owner
Home Financials are based on the most recent Mortgage that was taken out on this home.
Original Mortgage
$1,570,000
Interest Rate
5%
Mortgage Type
Purchase Money Mortgage
Create a Home Valuation Report for This Property
The Home Valuation Report is an in-depth analysis detailing your home's value as well as a comparison with similar homes in the area
Home Values in the Area
Average Home Value in this Area
Purchase History
| Date | Buyer | Sale Price | Title Company |
|---|---|---|---|
| Anderson J Scott J | $2,065,000 | Mid State Abstract Company | |
| Anderson J Scott J | $2,065,000 | Old Republic Title | |
| Leunes Paul | $1,375,000 | None Available | |
| Waldron Gerard | $1,285,000 | None Available | |
| Navesink Drive J V | $510,000 | Agent For Old Republic Nati |
Source: Public Records
Mortgage History
| Date | Status | Borrower | Loan Amount |
|---|---|---|---|
| Open | Anderson J Scott J | $750,000 | |
| Closed | Anderson J Scott J | $750,000 | |
| Previous Owner | Navesink Drive J V | $1,570,000 |
Source: Public Records
Tax History Compared to Growth
Tax History
| Year | Tax Paid | Tax Assessment Tax Assessment Total Assessment is a certain percentage of the fair market value that is determined by local assessors to be the total taxable value of land and additions on the property. | Land | Improvement |
|---|---|---|---|---|
| 2025 | $22,300 | $2,555,000 | $918,200 | $1,636,800 |
| 2024 | $21,829 | $2,287,200 | $743,200 | $1,544,000 |
| 2023 | $21,829 | $2,119,300 | $779,400 | $1,339,900 |
| 2022 | $19,188 | $2,014,000 | $594,400 | $1,419,600 |
| 2021 | $19,188 | $1,510,900 | $494,400 | $1,016,500 |
| 2020 | $17,982 | $1,466,700 | $534,400 | $932,300 |
| 2019 | $17,621 | $1,466,000 | $534,400 | $931,600 |
| 2018 | $17,341 | $1,411,000 | $499,000 | $912,000 |
| 2017 | $17,004 | $1,341,000 | $449,000 | $892,000 |
| 2016 | $5,279 | $399,000 | $399,000 | $0 |
Source: Public Records
Map
Nearby Homes
- 44 Monmouth Pkwy
- 1 Channel Dr Unit 214
- 1 Channel Dr Unit 1705
- 1 Channel Dr Unit 709
- 1 Channel Dr Unit 705
- 25 Spaulding Place
- 25 Meadow Ave Unit 30
- 92 Wharfside Dr
- 75 Wharfside Dr
- 173 Wharfside Dr Unit 805
- 31 Wesley St
- 26 Wesley St
- 2 Wharfside Dr Unit 2
- 79 Riverdale Ave
- 100 Seaview Ave Unit 3B
- 116 Ocean Ave
- 11 Gail Dr
- 9 Woolley St
- 8 Mann Ct
- 55 Ocean Ave Unit 3H
- 55 Navesink Dr
- 53 Navesink Dr
- 57 Navesink Dr
- 53A Navesink Dr
- 56 Monmouth Pkwy
- 54 Monmouth Pkwy
- 54 Navesink Dr
- 58 Monmouth Pkwy
- 51 Navesink Dr
- 59 Navesink Dr
- 52 Monmouth Pkwy
- 52 Navesink Dr
- 60 Navesink Dr
- 60 Monmouth Pkwy
- 50 Navesink Dr
- 49 Navesink Dr
- 50 Monmouth Pkwy
- 63 Navesink Dr
- 59 Monmouth Pkwy
- 62 Navesink Dr