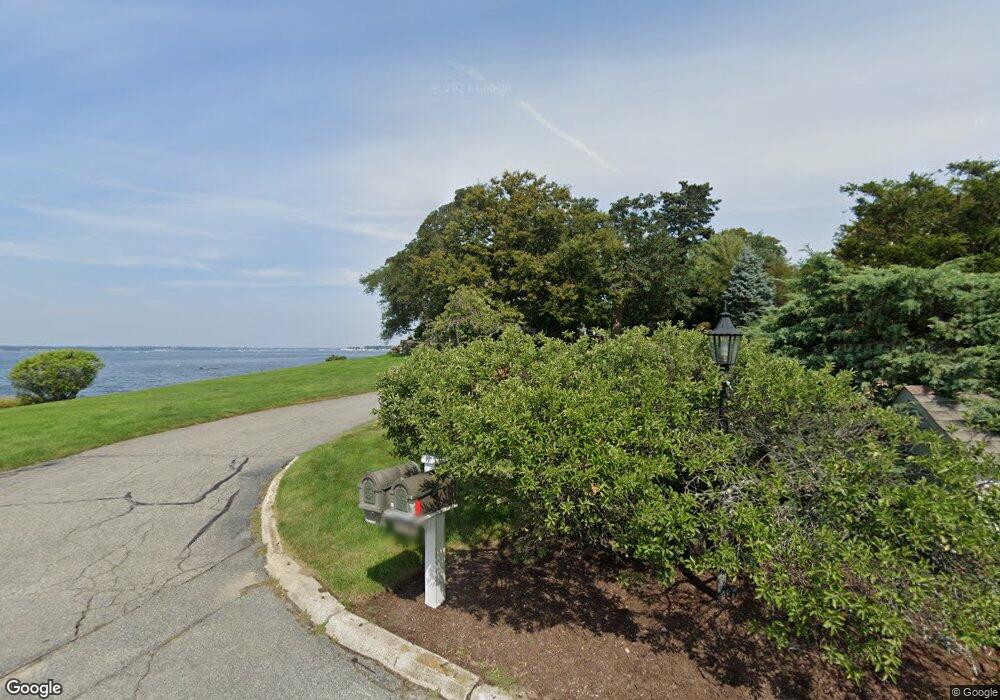
55 Nayatt Point Barrington, RI 02806
Nayatt NeighborhoodEstimated Value: $2,825,000 - $3,644,000
5
Beds
4
Baths
5,266
Sq Ft
$600/Sq Ft
Est. Value
About This Home
This home is located at 55 Nayatt Point, Barrington, RI 02806 and is currently estimated at $3,160,869, approximately $600 per square foot. 55 Nayatt Point is a home located in Bristol County with nearby schools including Barrington High School, St Luke Elementary School, and Barrington Christian Academy.
Ownership History
Date
Name
Owned For
Owner Type
Purchase Details
Closed on
Nov 30, 2006
Sold by
Dario Lawrence and Dario Stephanie
Bought by
Beitle Michael and Beitle Julie
Current Estimated Value
Home Financials for this Owner
Home Financials are based on the most recent Mortgage that was taken out on this home.
Original Mortgage
$1,110,000
Outstanding Balance
$665,483
Interest Rate
6.36%
Mortgage Type
Purchase Money Mortgage
Estimated Equity
$2,495,386
Create a Home Valuation Report for This Property
The Home Valuation Report is an in-depth analysis detailing your home's value as well as a comparison with similar homes in the area
Home Values in the Area
Average Home Value in this Area
Purchase History
| Date | Buyer | Sale Price | Title Company |
|---|---|---|---|
| Beitle Michael | $1,850,000 | -- |
Source: Public Records
Mortgage History
| Date | Status | Borrower | Loan Amount |
|---|---|---|---|
| Open | Beitle Michael | $1,110,000 |
Source: Public Records
Tax History Compared to Growth
Tax History
| Year | Tax Paid | Tax Assessment Tax Assessment Total Assessment is a certain percentage of the fair market value that is determined by local assessors to be the total taxable value of land and additions on the property. | Land | Improvement |
|---|---|---|---|---|
| 2025 | $51,190 | $3,337,000 | $1,729,000 | $1,608,000 |
| 2024 | $49,221 | $3,337,000 | $1,729,000 | $1,608,000 |
| 2023 | $45,594 | $2,246,000 | $1,166,000 | $1,080,000 |
| 2022 | $44,134 | $2,246,000 | $1,166,000 | $1,080,000 |
| 2021 | $43,011 | $2,246,000 | $1,166,000 | $1,080,000 |
| 2020 | $48,446 | $2,318,000 | $1,333,000 | $985,000 |
| 2019 | $46,230 | $2,300,000 | $1,333,000 | $967,000 |
| 2018 | $44,850 | $2,300,000 | $1,333,000 | $967,000 |
| 2017 | $42,948 | $2,147,400 | $1,365,800 | $781,600 |
| 2016 | $39,620 | $2,147,400 | $1,365,800 | $781,600 |
| 2015 | $39,190 | $2,147,400 | $1,365,800 | $781,600 |
| 2014 | $43,871 | $2,397,300 | $1,583,000 | $814,300 |
Source: Public Records
Map
Nearby Homes
- 85 Nayatt Rd
- 150 Alfred Drowne Rd
- 6 Conway Dr
- 4 Buckingham St
- 1 3rd St
- 381 Maple Ave
- 15 Elgin St Unit St
- 15 Elgin St
- 299 Narragansett Ave
- 7 Carpenter Ave
- 15 Spadina Ave
- 41 Spadina Ave
- 20 Townsend St
- 0 Bogman Rd
- 72 Highland Ave
- 205 Lincoln Ave
- 248 Point Ave
- 23 Clara Ave
- 164 Bay Spring Ave
- 29 Lake Ave