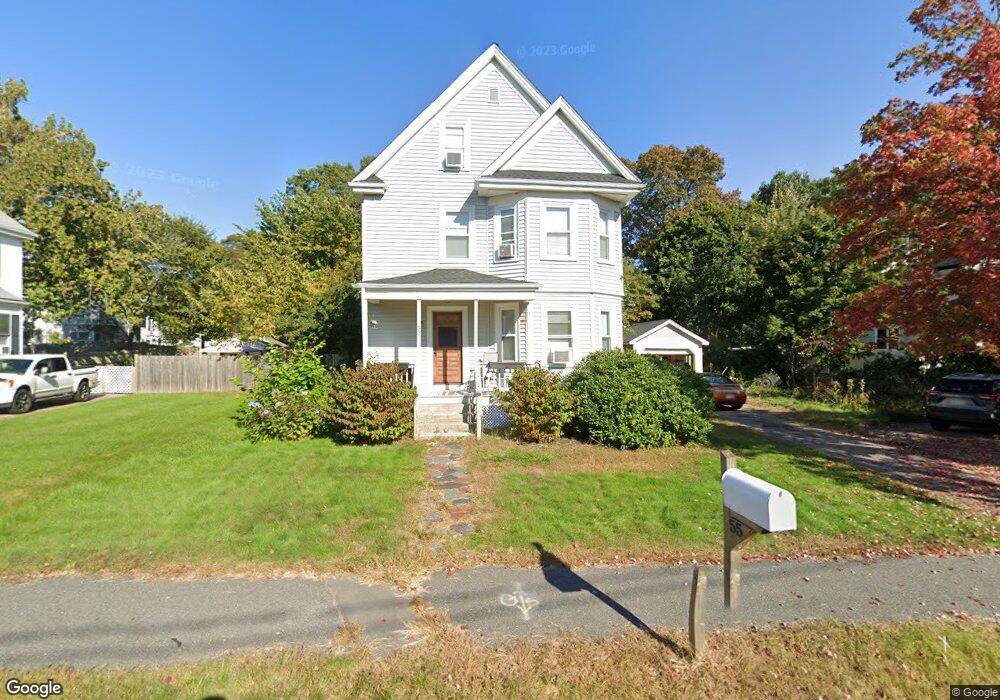
55 Neponset Ave Foxboro, MA 02035
Estimated Value: $560,816 - $655,000
3
Beds
2
Baths
1,673
Sq Ft
$355/Sq Ft
Est. Value
About This Home
This home is located at 55 Neponset Ave, Foxboro, MA 02035 and is currently estimated at $594,704, approximately $355 per square foot. 55 Neponset Ave is a home located in Norfolk County with nearby schools including Foxborough High School, Foxborough Regional Charter School, and The Sage School.
Ownership History
Date
Name
Owned For
Owner Type
Purchase Details
Closed on
May 29, 2024
Sold by
Tran Helena T
Bought by
Sks Ft and Tran
Current Estimated Value
Purchase Details
Closed on
Dec 12, 2018
Sold by
Tebeau David L and Tebeau Teresa F
Bought by
Tran Helen T and Tran Quang
Purchase Details
Closed on
Sep 16, 1988
Sold by
Saffelle Gail L
Bought by
Lavieri Frank P
Home Financials for this Owner
Home Financials are based on the most recent Mortgage that was taken out on this home.
Original Mortgage
$128,000
Interest Rate
10.43%
Mortgage Type
Purchase Money Mortgage
Purchase Details
Closed on
Aug 9, 1985
Bought by
Tebeau David L and Tebeau Teresa F
Create a Home Valuation Report for This Property
The Home Valuation Report is an in-depth analysis detailing your home's value as well as a comparison with similar homes in the area
Home Values in the Area
Average Home Value in this Area
Purchase History
| Date | Buyer | Sale Price | Title Company |
|---|---|---|---|
| Sks Ft | -- | None Available | |
| Sks Ft | -- | None Available | |
| Tran Helen T | $222,000 | -- | |
| Lavieri Frank P | $160,000 | -- | |
| Tebeau David L | -- | -- |
Source: Public Records
Mortgage History
| Date | Status | Borrower | Loan Amount |
|---|---|---|---|
| Previous Owner | Tebeau David L | $70,000 | |
| Previous Owner | Tebeau David L | $128,000 |
Source: Public Records
Tax History Compared to Growth
Tax History
| Year | Tax Paid | Tax Assessment Tax Assessment Total Assessment is a certain percentage of the fair market value that is determined by local assessors to be the total taxable value of land and additions on the property. | Land | Improvement |
|---|---|---|---|---|
| 2025 | $5,579 | $422,000 | $188,500 | $233,500 |
| 2024 | $5,709 | $422,600 | $203,100 | $219,500 |
| 2023 | $5,079 | $357,400 | $193,500 | $163,900 |
| 2022 | $4,985 | $343,300 | $173,500 | $169,800 |
| 2021 | $4,925 | $334,100 | $164,800 | $169,300 |
| 2020 | $4,868 | $334,100 | $164,800 | $169,300 |
| 2019 | $4,807 | $327,000 | $165,200 | $161,800 |
| 2018 | $4,384 | $300,900 | $157,000 | $143,900 |
| 2017 | $4,217 | $280,400 | $154,400 | $126,000 |
| 2016 | $4,113 | $277,500 | $148,600 | $128,900 |
| 2015 | $3,778 | $248,700 | $110,800 | $137,900 |
| 2014 | $3,728 | $248,700 | $110,800 | $137,900 |
Source: Public Records
Map
Nearby Homes