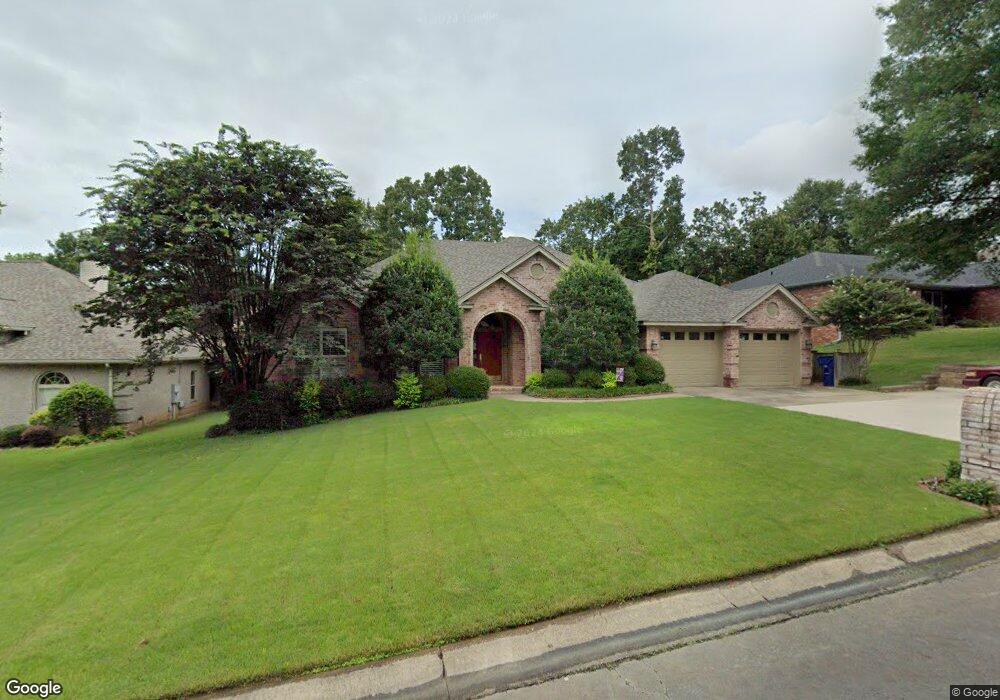
55 Ouachita Dr Maumelle, AR 72113
Estimated Value: $351,000 - $377,864
--
Bed
2
Baths
2,684
Sq Ft
$134/Sq Ft
Est. Value
About This Home
This home is located at 55 Ouachita Dr, Maumelle, AR 72113 and is currently estimated at $358,966, approximately $133 per square foot. 55 Ouachita Dr is a home located in Pulaski County with nearby schools including Crystal Hill Elementary School, Maumelle Middle School, and Maumelle High School.
Ownership History
Date
Name
Owned For
Owner Type
Purchase Details
Closed on
Nov 2, 1998
Sold by
James Roeder Construction Co
Bought by
Speck James M and Speck Vicki C
Current Estimated Value
Home Financials for this Owner
Home Financials are based on the most recent Mortgage that was taken out on this home.
Original Mortgage
$135,000
Outstanding Balance
$28,438
Interest Rate
6.46%
Mortgage Type
Purchase Money Mortgage
Estimated Equity
$330,528
Purchase Details
Closed on
Jul 1, 1998
Sold by
Speck James M and Speck Vicki C
Bought by
James Roeder Construction Co
Home Financials for this Owner
Home Financials are based on the most recent Mortgage that was taken out on this home.
Original Mortgage
$130,000
Interest Rate
9.25%
Mortgage Type
Purchase Money Mortgage
Create a Home Valuation Report for This Property
The Home Valuation Report is an in-depth analysis detailing your home's value as well as a comparison with similar homes in the area
Home Values in the Area
Average Home Value in this Area
Purchase History
| Date | Buyer | Sale Price | Title Company |
|---|---|---|---|
| Speck James M | $165,000 | Beach Abstract & Guaranty Co | |
| James Roeder Construction Co | -- | Beach Abstract & Guaranty Co |
Source: Public Records
Mortgage History
| Date | Status | Borrower | Loan Amount |
|---|---|---|---|
| Open | Speck James M | $135,000 | |
| Previous Owner | James Roeder Construction Co | $130,000 |
Source: Public Records
Tax History Compared to Growth
Tax History
| Year | Tax Paid | Tax Assessment Tax Assessment Total Assessment is a certain percentage of the fair market value that is determined by local assessors to be the total taxable value of land and additions on the property. | Land | Improvement |
|---|---|---|---|---|
| 2025 | $2,471 | $59,320 | $7,000 | $52,320 |
| 2024 | $2,761 | $59,320 | $7,000 | $52,320 |
| 2023 | $2,761 | $59,320 | $7,000 | $52,320 |
| 2022 | $2,471 | $59,320 | $7,000 | $52,320 |
| 2021 | $2,761 | $49,060 | $5,200 | $43,860 |
| 2020 | $2,386 | $49,060 | $5,200 | $43,860 |
| 2019 | $2,386 | $49,060 | $5,200 | $43,860 |
| 2018 | $2,411 | $49,060 | $5,200 | $43,860 |
| 2017 | $2,411 | $49,060 | $5,200 | $43,860 |
| 2016 | $2,761 | $52,450 | $8,400 | $44,050 |
| 2015 | $2,761 | $43,892 | $8,400 | $35,492 |
| 2014 | $2,761 | $43,892 | $8,400 | $35,492 |
Source: Public Records
Map
Nearby Homes
- 108 Scenic Ridge Dr
- 107 Hidden Falls Ln
- 25 Basswood Terrace
- 1 Greeson Cove
- 27 Basswood Terrace
- 131 Hidden Valley Loop
- 34 Basswood Terrace
- 4 Ouachita Dr
- 5 Greeson Cove
- 24 Winona Dr
- 124 Mountain Valley Dr
- 16 Winona Dr
- 8 Edgewater Cove
- 102 Creek Valley Ln
- 119 Maumelle Valley Dr
- 273 Mountain Terrace Cir
- 44 Hibiscus Cove
- 9 Mountain Ridge Cove
- 6 Winona Dr
- 184 Mountain Terrace Cir