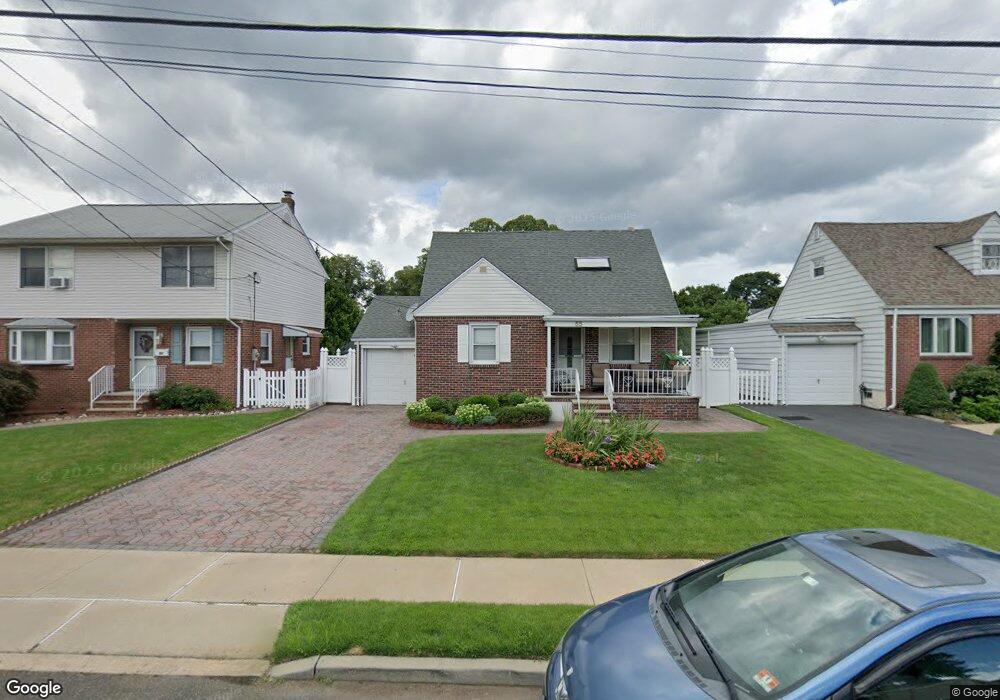
55 Palsa Ave Elmwood Park, NJ 07407
Estimated Value: $476,750 - $574,000
--
Bed
--
Bath
1,260
Sq Ft
$415/Sq Ft
Est. Value
About This Home
This home is located at 55 Palsa Ave, Elmwood Park, NJ 07407 and is currently estimated at $522,438, approximately $414 per square foot. 55 Palsa Ave is a home located in Bergen County with nearby schools including Gantner Avenue Elementary School, Elmwood Park Middle School, and Memorial Sr High School.
Ownership History
Date
Name
Owned For
Owner Type
Purchase Details
Closed on
Dec 30, 2002
Sold by
Bustos Roberto
Bought by
Dungo Oscar and Dungo Jesusa
Current Estimated Value
Home Financials for this Owner
Home Financials are based on the most recent Mortgage that was taken out on this home.
Original Mortgage
$216,750
Interest Rate
5.98%
Purchase Details
Closed on
Dec 6, 2000
Sold by
Kraus Paul F
Bought by
Bustos Roberto and Hernandez Sandra
Home Financials for this Owner
Home Financials are based on the most recent Mortgage that was taken out on this home.
Original Mortgage
$163,650
Interest Rate
7.71%
Mortgage Type
FHA
Create a Home Valuation Report for This Property
The Home Valuation Report is an in-depth analysis detailing your home's value as well as a comparison with similar homes in the area
Home Values in the Area
Average Home Value in this Area
Purchase History
| Date | Buyer | Sale Price | Title Company |
|---|---|---|---|
| Dungo Oscar | $255,000 | -- | |
| Bustos Roberto | $165,000 | -- |
Source: Public Records
Mortgage History
| Date | Status | Borrower | Loan Amount |
|---|---|---|---|
| Previous Owner | Dungo Oscar | $216,750 | |
| Previous Owner | Bustos Roberto | $163,650 |
Source: Public Records
Tax History Compared to Growth
Tax History
| Year | Tax Paid | Tax Assessment Tax Assessment Total Assessment is a certain percentage of the fair market value that is determined by local assessors to be the total taxable value of land and additions on the property. | Land | Improvement |
|---|---|---|---|---|
| 2025 | $7,498 | $244,300 | $180,000 | $64,300 |
| 2024 | $7,309 | $244,300 | $180,000 | $64,300 |
| 2023 | $7,358 | $244,300 | $180,000 | $64,300 |
| 2022 | $7,358 | $244,300 | $180,000 | $64,300 |
| 2021 | $7,393 | $244,300 | $180,000 | $64,300 |
| 2020 | $7,334 | $244,300 | $180,000 | $64,300 |
| 2019 | $7,209 | $244,300 | $180,000 | $64,300 |
| 2018 | $7,141 | $244,300 | $180,000 | $64,300 |
| 2017 | $7,058 | $244,300 | $180,000 | $64,300 |
| 2016 | $6,911 | $244,300 | $180,000 | $64,300 |
| 2015 | $6,799 | $244,300 | $180,000 | $64,300 |
| 2014 | $6,594 | $244,300 | $180,000 | $64,300 |
Source: Public Records
Map
Nearby Homes