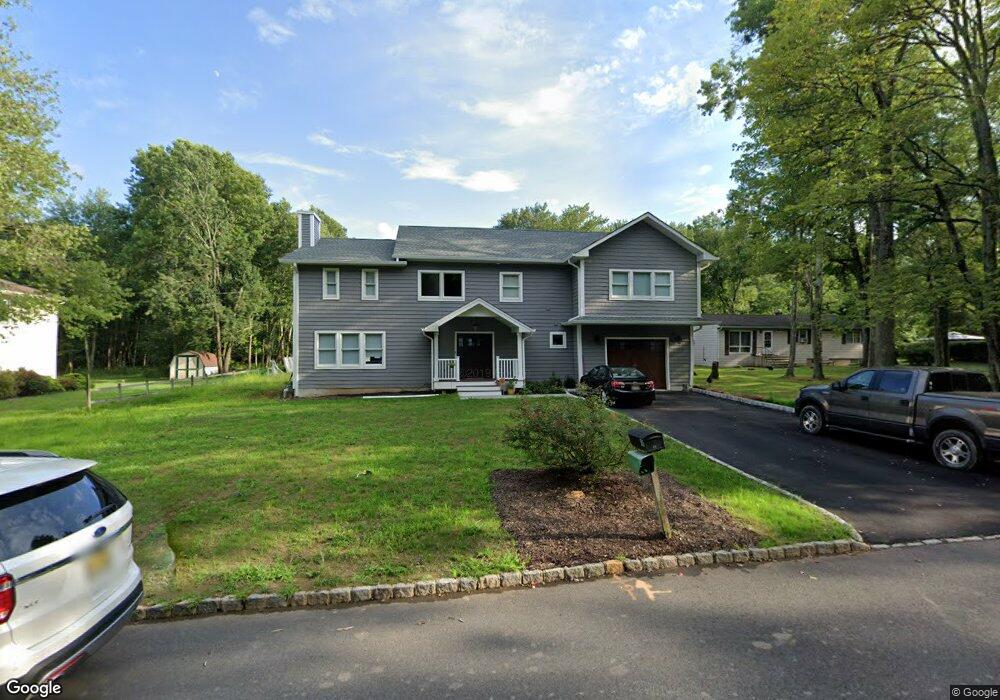
55 Preston Rd Parsippany, NJ 07054
Estimated Value: $583,000 - $921,000
--
Bed
--
Bath
2,530
Sq Ft
$306/Sq Ft
Est. Value
About This Home
This home is located at 55 Preston Rd, Parsippany, NJ 07054 and is currently estimated at $774,538, approximately $306 per square foot. 55 Preston Rd is a home located in Morris County with nearby schools including Troy Hills School, Central Middle School, and Parsippany High School.
Ownership History
Date
Name
Owned For
Owner Type
Purchase Details
Closed on
Aug 12, 2008
Sold by
Pedersen Christian W
Bought by
Mcgarry Peter P and Bakunas Lauren
Current Estimated Value
Home Financials for this Owner
Home Financials are based on the most recent Mortgage that was taken out on this home.
Original Mortgage
$315,000
Outstanding Balance
$206,337
Interest Rate
6.29%
Mortgage Type
Purchase Money Mortgage
Estimated Equity
$568,201
Purchase Details
Closed on
Jul 7, 1998
Sold by
Pederson Florence R and Russell Florence P
Bought by
Pedersen Florence R and Pedersen Christian W
Create a Home Valuation Report for This Property
The Home Valuation Report is an in-depth analysis detailing your home's value as well as a comparison with similar homes in the area
Home Values in the Area
Average Home Value in this Area
Purchase History
| Date | Buyer | Sale Price | Title Company |
|---|---|---|---|
| Mcgarry Peter P | $350,000 | Fidelity Natl Title Ins Co | |
| Pedersen Florence R | -- | -- |
Source: Public Records
Mortgage History
| Date | Status | Borrower | Loan Amount |
|---|---|---|---|
| Open | Mcgarry Peter P | $315,000 |
Source: Public Records
Tax History Compared to Growth
Tax History
| Year | Tax Paid | Tax Assessment Tax Assessment Total Assessment is a certain percentage of the fair market value that is determined by local assessors to be the total taxable value of land and additions on the property. | Land | Improvement |
|---|---|---|---|---|
| 2025 | $12,324 | $361,400 | $189,600 | $171,800 |
| 2024 | $12,096 | $361,400 | $189,600 | $171,800 |
| 2023 | $12,096 | $361,400 | $189,600 | $171,800 |
| 2022 | $11,308 | $361,400 | $189,600 | $171,800 |
| 2021 | $11,308 | $361,400 | $189,600 | $171,800 |
| 2020 | $11,066 | $361,400 | $189,600 | $171,800 |
| 2019 | $8,505 | $285,500 | $189,600 | $95,900 |
| 2018 | $8,317 | $285,500 | $189,600 | $95,900 |
| 2017 | $8,125 | $285,500 | $189,600 | $95,900 |
| 2016 | $7,980 | $285,500 | $189,600 | $95,900 |
| 2015 | $7,777 | $285,500 | $189,600 | $95,900 |
| 2014 | $7,671 | $285,500 | $189,600 | $95,900 |
Source: Public Records
Map
Nearby Homes