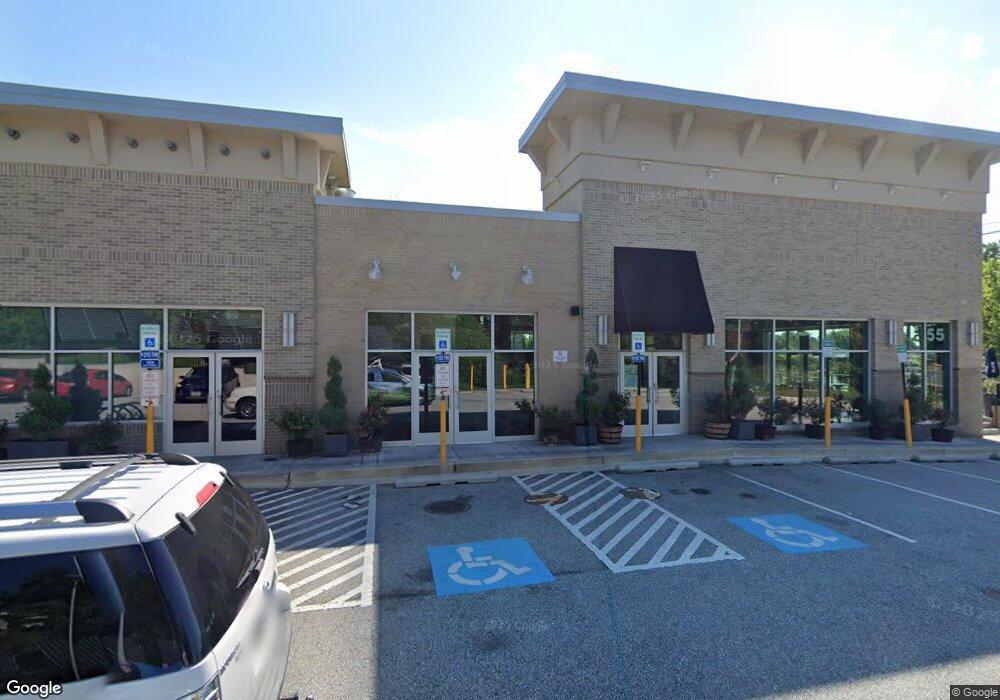
55 Randolph Rd Silver Spring, MD 20904
Studio
1
Bath
20,806
Sq Ft
56,454
Sq Ft Lot
About This Home
This home is located at 55 Randolph Rd, Silver Spring, MD 20904. 55 Randolph Rd is a home located in Montgomery County with nearby schools including Westover Elementary School, White Oak Middle School, and Springbrook High School.
Ownership History
Date
Name
Owned For
Owner Type
Purchase Details
Closed on
Mar 6, 2006
Sold by
Song Ju
Bought by
Pioneer Hills Llp
Purchase Details
Closed on
Oct 26, 2005
Sold by
Niglio Emilio Paul
Bought by
Song Ju
Home Financials for this Owner
Home Financials are based on the most recent Mortgage that was taken out on this home.
Original Mortgage
$975,000
Interest Rate
5.85%
Mortgage Type
Commercial
Purchase Details
Closed on
Aug 12, 2004
Sold by
R&Olph Road Lllp
Bought by
Niglio Paul and Niglio Nicoletta G
Purchase Details
Closed on
Feb 12, 2004
Sold by
Albert Deborah H
Bought by
Randolpj Road Lllp
Purchase Details
Closed on
May 17, 2000
Sold by
Hutchison Mary L
Bought by
Albert Deborah H
Purchase Details
Closed on
Jan 15, 1997
Sold by
Hutchinson Culver
Bought by
Hutchison Mary L
Create a Home Valuation Report for This Property
The Home Valuation Report is an in-depth analysis detailing your home's value as well as a comparison with similar homes in the area
Home Values in the Area
Average Home Value in this Area
Purchase History
| Date | Buyer | Sale Price | Title Company |
|---|---|---|---|
| Pioneer Hills Llp | $1,500,000 | -- | |
| Song Ju | $1,300,000 | -- | |
| Song Ju | $1,300,000 | -- | |
| Niglio Paul | $1,000,000 | -- | |
| Niglio Paul | $1,000,000 | -- | |
| Randolpj Road Lllp | $550,000 | -- | |
| Randolpj Road Lllp | $550,000 | -- | |
| Albert Deborah H | -- | -- | |
| Hutchison Mary L | -- | -- |
Source: Public Records
Mortgage History
| Date | Status | Borrower | Loan Amount |
|---|---|---|---|
| Previous Owner | Song Ju | $975,000 |
Source: Public Records
Tax History
| Year | Tax Paid | Tax Assessment Tax Assessment Total Assessment is a certain percentage of the fair market value that is determined by local assessors to be the total taxable value of land and additions on the property. | Land | Improvement |
|---|---|---|---|---|
| 2025 | $35,664 | $2,796,500 | $677,200 | $2,119,300 |
| 2024 | $35,664 | $2,606,000 | $0 | $0 |
| 2023 | $0 | $2,415,500 | $0 | $0 |
| 2022 | $30,184 | $2,225,000 | $677,200 | $1,547,800 |
| 2020 | $0 | $2,731,000 | $677,200 | $2,053,800 |
| 2019 | $41,195 | $3,281,500 | $677,200 | $2,604,300 |
| 2018 | $36,251 | $3,281,500 | $677,200 | $2,604,300 |
| 2017 | $7,529 | $3,281,500 | $0 | $0 |
| 2016 | -- | $654,600 | $0 | $0 |
| 2015 | $8,764 | $654,600 | $0 | $0 |
| 2014 | $8,764 | $654,600 | $0 | $0 |
Source: Public Records
Map
Nearby Homes
- 13707 Notley Rd
- 13711 Notley Rd
- 13719 Notley Rd
- 13704 New Hampshire Ave
- 13715 Notley Rd
- 12916 Shaw Place
- 115 Lillian Ln
- 7 Shaw Ave
- 3 Shannon Ct
- 421 Beaumont Rd
- 13137 Broadmore Rd
- 605 Rosemere Ave
- 412 Vierling Dr
- 216 Paula Lynn Dr
- 513 Beaumont Rd
- 816 Rosemere Ave
- 600 Seminole Creek Way
- 606 Winhall Way
- 604 Hawkesbury Terrace
- 609 Seminole Creek Way
- 25 Randolph Rd
- 14 Dawn View Ct
- 7 Morning Breeze Ct
- 9 Morning Breeze Ct
- 5 Morning Breeze Ct
- 11 Morning Breeze Ct
- 3 Morning Breeze Ct
- 16 Dawn View Ct
- 1 Morning Breeze Ct
- 18 Dawn View Ct
- 10 Dawn View Ct
- 8 Dawn View Ct
- 17 Randolph Rd
- 20 Dawn View Ct
- 6 Dawn View Ct
- 22 Dawn View Ct
- 15 Morning Breeze Ct
- 4 Dawn View Ct
- 24 Dawn View Ct
- 17 Morning Breeze Ct
Your Personal Tour Guide
Ask me questions while you tour the home.