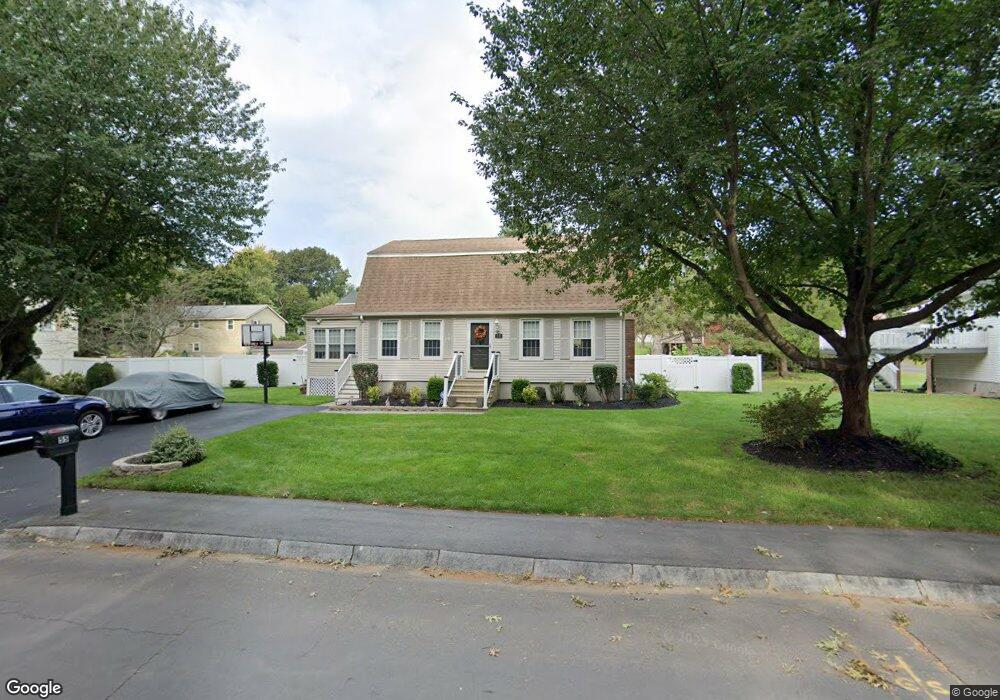
55 Riverview Blvd Methuen, MA 01844
The East End NeighborhoodEstimated Value: $579,000 - $635,000
3
Beds
2
Baths
1,632
Sq Ft
$376/Sq Ft
Est. Value
About This Home
This home is located at 55 Riverview Blvd, Methuen, MA 01844 and is currently estimated at $613,678, approximately $376 per square foot. 55 Riverview Blvd is a home located in Essex County with nearby schools including Timony Grammar School, Methuen High School, and Community Day Charter Public School - Gateway.
Ownership History
Date
Name
Owned For
Owner Type
Purchase Details
Closed on
Aug 25, 1998
Sold by
Palmisano Robert J
Bought by
Pelczar Steven C
Current Estimated Value
Home Financials for this Owner
Home Financials are based on the most recent Mortgage that was taken out on this home.
Original Mortgage
$110,000
Interest Rate
6.86%
Mortgage Type
Purchase Money Mortgage
Purchase Details
Closed on
Aug 13, 1998
Sold by
Department Of Housing & Urban Dev
Bought by
Palmisano Robert J
Home Financials for this Owner
Home Financials are based on the most recent Mortgage that was taken out on this home.
Original Mortgage
$110,000
Interest Rate
6.86%
Mortgage Type
Purchase Money Mortgage
Purchase Details
Closed on
Aug 31, 1993
Sold by
Newton Robert F
Bought by
Hayes James R
Create a Home Valuation Report for This Property
The Home Valuation Report is an in-depth analysis detailing your home's value as well as a comparison with similar homes in the area
Home Values in the Area
Average Home Value in this Area
Purchase History
| Date | Buyer | Sale Price | Title Company |
|---|---|---|---|
| Pelczar Steven C | $164,000 | -- | |
| Pelczar Steven C | $164,000 | -- | |
| Palmisano Robert J | $120,000 | -- | |
| Palmisano Robert J | $120,000 | -- | |
| Hayes James R | $120,000 | -- | |
| Hayes James R | $120,000 | -- |
Source: Public Records
Mortgage History
| Date | Status | Borrower | Loan Amount |
|---|---|---|---|
| Open | Hayes James R | $95,000 | |
| Closed | Hayes James R | $20,000 | |
| Closed | Hayes James R | $110,000 |
Source: Public Records
Tax History
| Year | Tax Paid | Tax Assessment Tax Assessment Total Assessment is a certain percentage of the fair market value that is determined by local assessors to be the total taxable value of land and additions on the property. | Land | Improvement |
|---|---|---|---|---|
| 2025 | $5,707 | $539,400 | $207,200 | $332,200 |
| 2024 | $5,549 | $511,000 | $189,000 | $322,000 |
| 2023 | $5,270 | $450,400 | $168,000 | $282,400 |
| 2022 | $4,895 | $375,100 | $140,000 | $235,100 |
| 2021 | $4,751 | $360,200 | $133,000 | $227,200 |
| 2020 | $4,605 | $342,600 | $133,000 | $209,600 |
| 2019 | $4,297 | $302,800 | $119,000 | $183,800 |
| 2018 | $4,148 | $290,700 | $119,000 | $171,700 |
| 2017 | $4,168 | $284,500 | $119,000 | $165,500 |
| 2016 | $4,019 | $271,400 | $112,000 | $159,400 |
| 2015 | $3,830 | $262,300 | $112,000 | $150,300 |
Source: Public Records
Map
Nearby Homes
- 1 Riverview Blvd Unit 8-203
- 32 Josephine Ave
- 68 Ashford St
- 18 Erhardt Terrace
- 7 Erhardt Terrace
- 264 E Haverhill St Unit 2
- 106 Leroy Ave
- 60 Ames St
- 12 Annette St
- 39 Swan Ave
- 2 Leslie St
- 30 Anderson Dr
- 14 Court St
- 65 Arthur St
- 0 Great Pond Rd
- 16 Christopher Dr Unit 38
- 45 Christopher Dr Unit 106
- 5 Pilgrim Cir Unit C
- 27 Woodland Ct
- 17 Ferry Rd
Your Personal Tour Guide
Ask me questions while you tour the home.