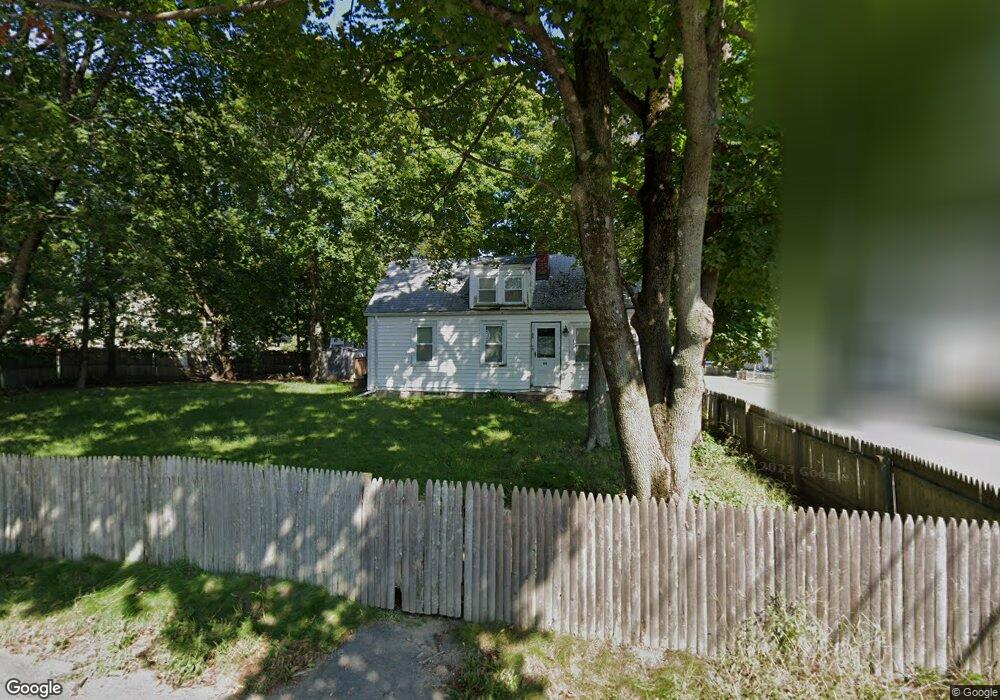
55 Roel St Randolph, MA 02368
North Randolph NeighborhoodEstimated Value: $428,000 - $527,000
3
Beds
1
Bath
988
Sq Ft
$473/Sq Ft
Est. Value
About This Home
This home is located at 55 Roel St, Randolph, MA 02368 and is currently estimated at $467,527, approximately $473 per square foot. 55 Roel St is a home located in Norfolk County with nearby schools including Randolph High School, Boston Higashi School, and Lighthouse Baptist Christian Academy.
Ownership History
Date
Name
Owned For
Owner Type
Purchase Details
Closed on
Jul 30, 2004
Sold by
Hayward Patricia and Hayward Steven
Bought by
Turgeon Debra J and Turgeon Michael E
Current Estimated Value
Home Financials for this Owner
Home Financials are based on the most recent Mortgage that was taken out on this home.
Original Mortgage
$238,355
Outstanding Balance
$120,777
Interest Rate
6.33%
Mortgage Type
Purchase Money Mortgage
Estimated Equity
$346,750
Create a Home Valuation Report for This Property
The Home Valuation Report is an in-depth analysis detailing your home's value as well as a comparison with similar homes in the area
Home Values in the Area
Average Home Value in this Area
Purchase History
| Date | Buyer | Sale Price | Title Company |
|---|---|---|---|
| Turgeon Debra J | $250,900 | -- |
Source: Public Records
Mortgage History
| Date | Status | Borrower | Loan Amount |
|---|---|---|---|
| Open | Turgeon Debra J | $238,355 |
Source: Public Records
Tax History
| Year | Tax Paid | Tax Assessment Tax Assessment Total Assessment is a certain percentage of the fair market value that is determined by local assessors to be the total taxable value of land and additions on the property. | Land | Improvement |
|---|---|---|---|---|
| 2025 | $4,696 | $404,500 | $227,100 | $177,400 |
| 2024 | $4,597 | $401,500 | $222,600 | $178,900 |
| 2023 | $4,300 | $356,000 | $202,300 | $153,700 |
| 2022 | $4,164 | $306,200 | $168,600 | $137,600 |
| 2021 | $3,866 | $261,600 | $140,500 | $121,100 |
| 2020 | $3,801 | $254,900 | $140,500 | $114,400 |
| 2019 | $3,640 | $243,000 | $133,800 | $109,200 |
| 2018 | $3,384 | $213,100 | $121,700 | $91,400 |
| 2017 | $3,354 | $207,300 | $115,900 | $91,400 |
| 2016 | $3,248 | $186,800 | $105,300 | $81,500 |
| 2015 | $3,135 | $173,200 | $100,300 | $72,900 |
Source: Public Records
Map
Nearby Homes
- 26 Jasper Ln Unit 26
- 54 Jasper Ln
- 43 West St Unit A2
- 591 N Main St
- 22 Clark St
- 153 West St
- 20 Simmonds Blvd Unit 20
- 18 Simmonds Blvd Unit 18
- 8 Simmonds Blvd Unit 8
- 22 Simmonds Blvd Unit 22
- 10 Simmonds Blvd Unit 10
- 24 Simmonds Blvd Unit 24
- 6 Simmonds Blvd Unit 6
- 34 Orchard St
- 469 North St
- 14 Oak Grove Rd
- 10 Alfred Terrace
- 33 Hemlock Terrace
- 17 Mazzeo Dr
- 12 Tucker Terrace
- 51 Roel St
- 47 Mount Pleasant Square
- 58 Allen St
- 49 Roel St
- 51 Allen St
- 51 Allen St Unit 1
- 14 Mount Pleasant Square
- 55 Mount Pleasant Square
- 41 Mount Pleasant Square
- 36 Roel St
- 45 Roel St
- 64 Allen St
- 4 Mount Pleasant Square
- 63 Allen St
- 66 Allen St
- 42 Mount Pleasant Square
- 42 Mount Pleasant Square Unit 42
- 32 Roel St
- 70 Allen St
- 48 Mount Pleasant Square
Your Personal Tour Guide
Ask me questions while you tour the home.