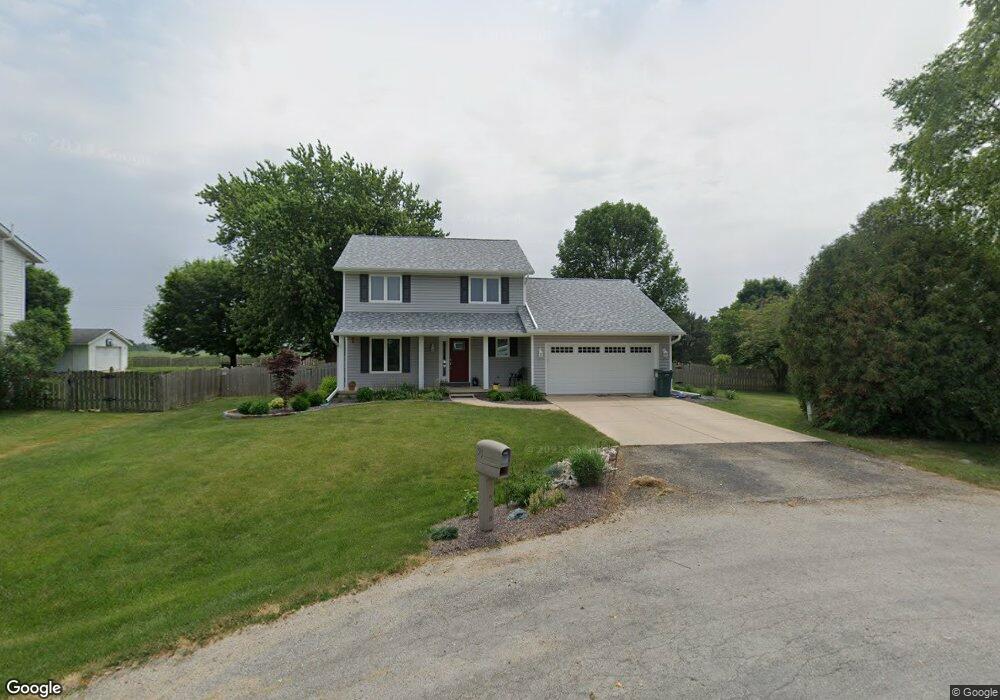
55 Rose Ct W Geneseo, IL 61254
Estimated Value: $270,180 - $288,000
3
Beds
3
Baths
1,691
Sq Ft
$166/Sq Ft
Est. Value
About This Home
This home is located at 55 Rose Ct W, Geneseo, IL 61254 and is currently estimated at $281,045, approximately $166 per square foot. 55 Rose Ct W is a home located in Henry County with nearby schools including Geneseo High School.
Create a Home Valuation Report for This Property
The Home Valuation Report is an in-depth analysis detailing your home's value as well as a comparison with similar homes in the area
Home Values in the Area
Average Home Value in this Area
Tax History Compared to Growth
Tax History
| Year | Tax Paid | Tax Assessment Tax Assessment Total Assessment is a certain percentage of the fair market value that is determined by local assessors to be the total taxable value of land and additions on the property. | Land | Improvement |
|---|---|---|---|---|
| 2024 | $5,699 | $78,332 | $8,107 | $70,225 |
| 2023 | $5,081 | $72,262 | $7,479 | $64,783 |
| 2022 | $4,741 | $66,540 | $6,887 | $59,653 |
| 2021 | $4,402 | $61,611 | $6,377 | $55,234 |
| 2020 | $4,238 | $59,955 | $6,205 | $53,750 |
| 2019 | $4,161 | $59,060 | $6,113 | $52,947 |
| 2018 | $4,045 | $57,340 | $5,935 | $51,405 |
| 2017 | $3,929 | $55,833 | $5,779 | $50,054 |
| 2016 | $3,926 | $55,555 | $5,750 | $49,805 |
| 2015 | $3,837 | $55,555 | $5,750 | $49,805 |
| 2013 | $3,837 | $56,116 | $5,808 | $50,308 |
Source: Public Records
Map
Nearby Homes
- 13 Mary Lane Ct
- 109 Hillcrest Dr
- 3303 Valley Dr
- 3309 Valley Dr
- 226 Longview Ct
- 159 Deer Park Dr
- 135 S Park Ct
- 211 Longview Dr
- 7 Oak Grove Rd
- 40 White Pine Rd
- 38 White Pine Rd
- 26299 1st Ave N
- 9554 Rock River View
- 27 Crestview Dr
- 25622 1st Ave N
- 18 Maple Ct
- 106 Lakeview Dr
- 109 N 3rd St
- 104 N 2nd St
- 55 Rustic Lake Dr
- 56 Rose Ct W
- 54 Rose Ct W
- 51 Rose Ct W
- 57 Rose Ct W
- 52 Rose Ct W
- 53 Rose Ct W
- 61 & 62 Rose Ct E
- 61,62,63 & 64 Rose Ct E
- Lot# 62 Rose Ct E
- Lot 63 Rose Ct E
- Lot 64 Rose Ct E
- Lot 62 Rose Ct E
- Lot 61 Rose Ct E
- Lot 61,62,63,64 Rose Ct E
- 50 Rose Ct W
- 58 Rose Ct E
- 67 Rose Ct E
- 59 Rose Ct E
- 48 Tulip Ct
- 49 Tulip Ct