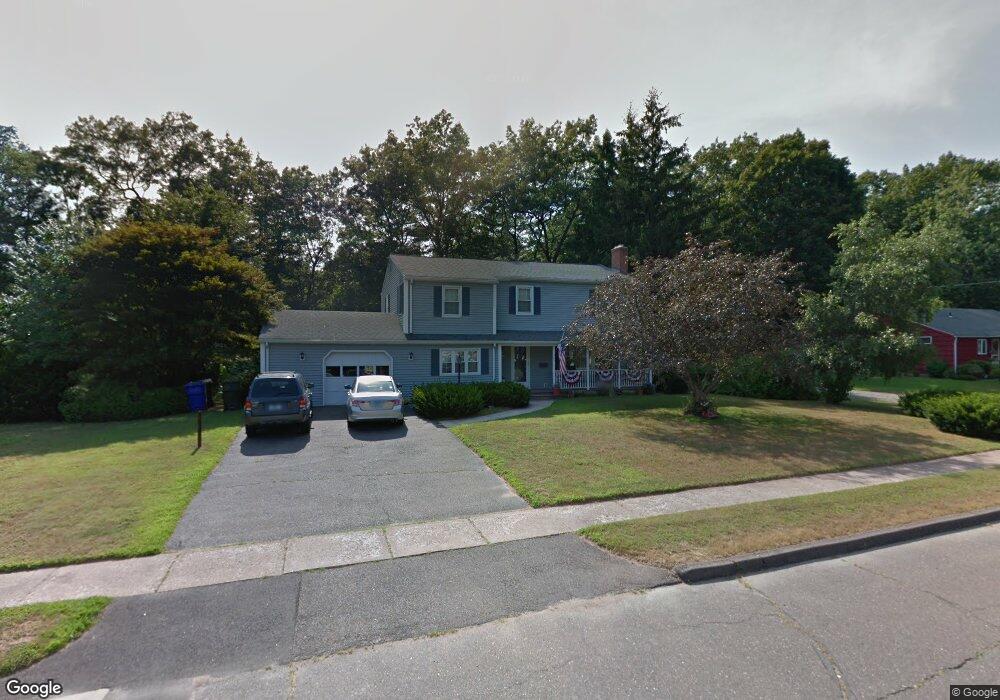
55 Rowland Dr East Hartford, CT 06118
Estimated Value: $335,000 - $405,000
4
Beds
3
Baths
2,002
Sq Ft
$186/Sq Ft
Est. Value
About This Home
This home is located at 55 Rowland Dr, East Hartford, CT 06118 and is currently estimated at $373,329, approximately $186 per square foot. 55 Rowland Dr is a home located in Hartford County with nearby schools including Governor William Pitkin School, East Hartford Middle School, and East Hartford High School.
Ownership History
Date
Name
Owned For
Owner Type
Purchase Details
Closed on
Aug 11, 2025
Sold by
Kolaskinski Judith A
Bought by
Kolaskinski Cheryl
Current Estimated Value
Create a Home Valuation Report for This Property
The Home Valuation Report is an in-depth analysis detailing your home's value as well as a comparison with similar homes in the area
Home Values in the Area
Average Home Value in this Area
Purchase History
| Date | Buyer | Sale Price | Title Company |
|---|---|---|---|
| Kolaskinski Cheryl | -- | -- |
Source: Public Records
Tax History Compared to Growth
Tax History
| Year | Tax Paid | Tax Assessment Tax Assessment Total Assessment is a certain percentage of the fair market value that is determined by local assessors to be the total taxable value of land and additions on the property. | Land | Improvement |
|---|---|---|---|---|
| 2025 | $7,465 | $162,630 | $47,010 | $115,620 |
| 2024 | $7,156 | $162,630 | $47,010 | $115,620 |
| 2023 | $6,918 | $162,630 | $47,010 | $115,620 |
| 2022 | $6,668 | $162,630 | $47,010 | $115,620 |
| 2021 | $6,360 | $128,870 | $35,620 | $93,250 |
| 2020 | $6,433 | $128,870 | $35,620 | $93,250 |
| 2019 | $6,329 | $128,870 | $35,620 | $93,250 |
| 2018 | $6,142 | $128,870 | $35,620 | $93,250 |
| 2017 | $6,063 | $128,870 | $35,620 | $93,250 |
| 2016 | $5,940 | $129,520 | $33,920 | $95,600 |
| 2015 | $5,940 | $129,520 | $33,920 | $95,600 |
| 2014 | $5,880 | $129,520 | $33,920 | $95,600 |
Source: Public Records
Map
Nearby Homes
- 94 Lydall Rd
- 30 Shaughnessy Dr
- 50 Hilton Dr
- 381 Oak St
- 604 Forest St
- 366 Hills St
- 122 Janet Dr
- 42 Patton St
- 0 Deborah Dr Unit 117 24077631
- 0 Deborah Dr Unit 115
- 143R Oak St
- 49 Deborah Dr Unit 123
- 6 Judy Dr
- 115 Greenwood St
- 42 Godar Terrace
- 27 Heron Rd
- 4 Gladys Rd
- 1060 Forbes St
- 95 Hills St
- 18 Romar Dr