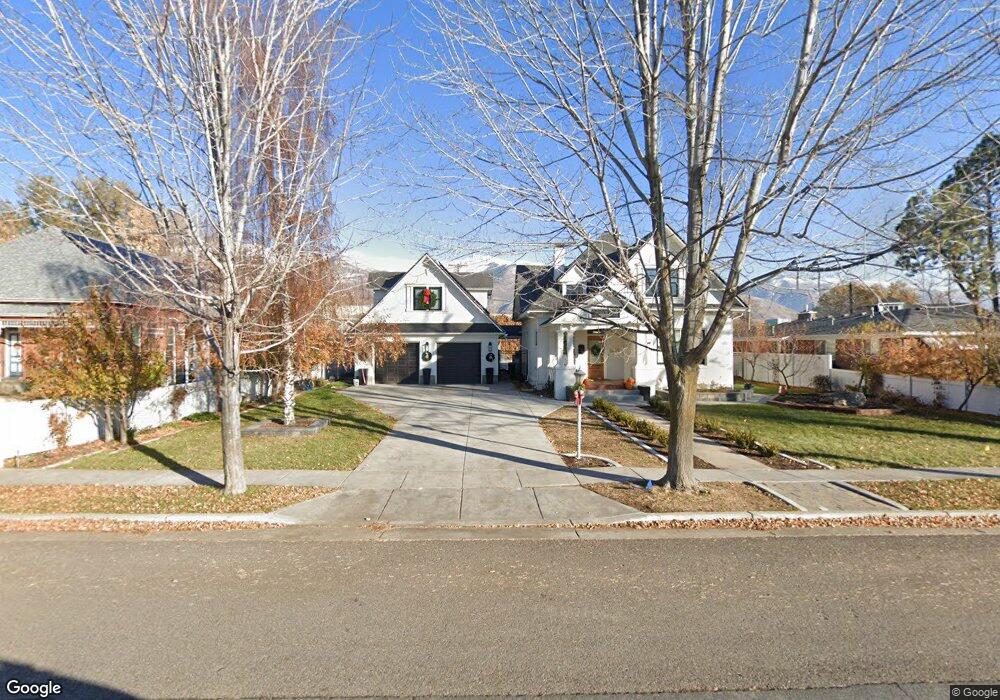
55 S 100 W Kaysville, UT 84037
Estimated Value: $729,000 - $973,000
3
Beds
2
Baths
3,386
Sq Ft
$237/Sq Ft
Est. Value
About This Home
This home is located at 55 S 100 W, Kaysville, UT 84037 and is currently estimated at $802,556, approximately $237 per square foot. 55 S 100 W is a home located in Davis County with nearby schools including Columbia Elementary School, Kaysville Junior High School, and Davis High School.
Ownership History
Date
Name
Owned For
Owner Type
Purchase Details
Closed on
Dec 18, 2019
Sold by
Christopher Jon D
Bought by
Christopher Nathan D and Christopher Raechel
Current Estimated Value
Home Financials for this Owner
Home Financials are based on the most recent Mortgage that was taken out on this home.
Original Mortgage
$420,000
Outstanding Balance
$370,290
Interest Rate
3.6%
Mortgage Type
Seller Take Back
Estimated Equity
$432,266
Purchase Details
Closed on
Feb 2, 2010
Sold by
Christopher Jon D and Christopher Susan
Bought by
Christopher Jon D and Christopher Susan
Purchase Details
Closed on
Jul 13, 1998
Sold by
Argyle Horace M and Argyle Joyce B
Bought by
Christopher Jon D and Christopher Susan
Home Financials for this Owner
Home Financials are based on the most recent Mortgage that was taken out on this home.
Original Mortgage
$100,000
Interest Rate
6.65%
Create a Home Valuation Report for This Property
The Home Valuation Report is an in-depth analysis detailing your home's value as well as a comparison with similar homes in the area
Home Values in the Area
Average Home Value in this Area
Purchase History
| Date | Buyer | Sale Price | Title Company |
|---|---|---|---|
| Christopher Nathan D | -- | Us Title Company Of Ut | |
| Christopher Jon D | -- | None Available | |
| Christopher Jon D | -- | Preferred Title & Escrow |
Source: Public Records
Mortgage History
| Date | Status | Borrower | Loan Amount |
|---|---|---|---|
| Open | Christopher Nathan D | $420,000 | |
| Previous Owner | Christopher Jon D | $100,000 |
Source: Public Records
Tax History Compared to Growth
Tax History
| Year | Tax Paid | Tax Assessment Tax Assessment Total Assessment is a certain percentage of the fair market value that is determined by local assessors to be the total taxable value of land and additions on the property. | Land | Improvement |
|---|---|---|---|---|
| 2024 | $3,479 | $366,850 | $201,593 | $165,257 |
| 2023 | $3,486 | $651,000 | $343,810 | $307,190 |
| 2022 | $3,407 | $356,950 | $173,017 | $183,933 |
| 2021 | $2,955 | $464,000 | $227,666 | $236,334 |
| 2020 | $2,649 | $405,000 | $160,960 | $244,040 |
| 2019 | $2,438 | $366,000 | $115,814 | $250,186 |
| 2018 | $2,265 | $339,000 | $105,286 | $233,714 |
| 2016 | $2,279 | $179,355 | $39,745 | $139,610 |
| 2015 | $2,145 | $160,270 | $39,745 | $120,525 |
| 2014 | $2,229 | $169,561 | $39,745 | $129,816 |
| 2013 | -- | $130,741 | $37,360 | $93,381 |
Source: Public Records
Map
Nearby Homes
- 80 E Center St
- 87 E 100 S
- 32 Belmore Dr
- 203 S Larkin Ln
- 203 W 350 S
- 172 W 400 S
- 309 E 100 S
- 300 S Larkin Ln
- 331 E 100 S
- 71 W 450 S
- 337 W 350 S
- 1236 E 100 S
- 400 N 100 E
- 384 Christine Way
- 457 N 150 E
- 558 S 50 E
- 75 S Grandison Ct E Unit 69-R
- 86 S Grandison Ct E Unit 79-R
- 127 S Rock Loft Ridge Dr Unit 57-R
- 159 S Rock Loft Ridge Dr Unit 59-R