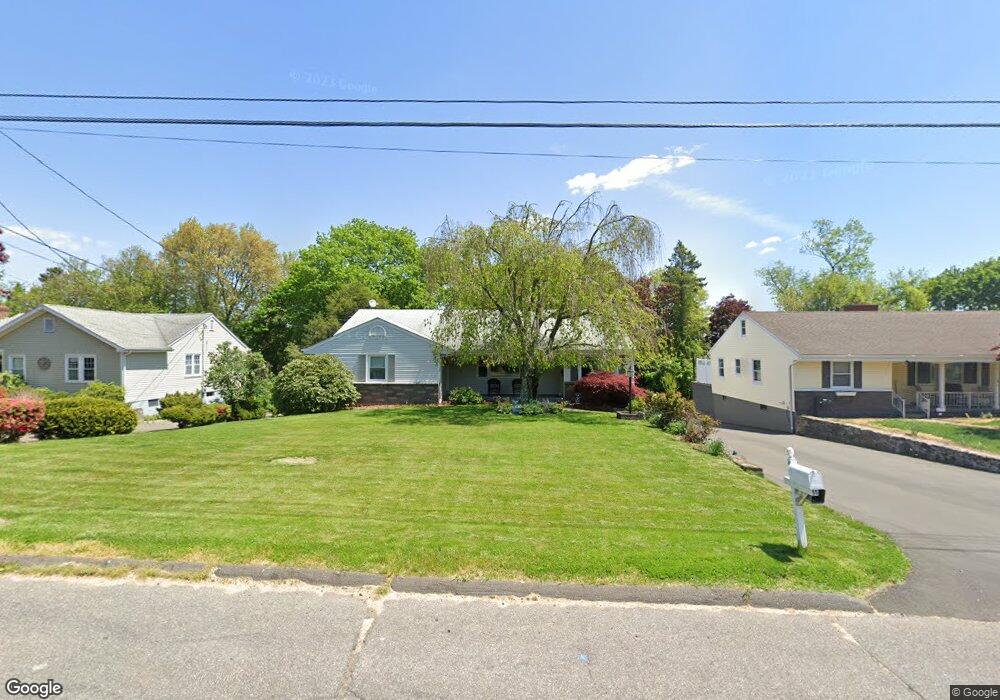
55 Sherman Ave Trumbull, CT 06611
Estimated Value: $617,491 - $680,000
3
Beds
2
Baths
2,169
Sq Ft
$299/Sq Ft
Est. Value
About This Home
This home is located at 55 Sherman Ave, Trumbull, CT 06611 and is currently estimated at $648,373, approximately $298 per square foot. 55 Sherman Ave is a home located in Fairfield County with nearby schools including Middlebrook School, Madison Middle School, and Trumbull High School.
Ownership History
Date
Name
Owned For
Owner Type
Purchase Details
Closed on
Sep 24, 2008
Sold by
Horsak Jonathan P and Horsak Cara Campbell
Bought by
Walsh Patrick and Walsh Lauren
Current Estimated Value
Home Financials for this Owner
Home Financials are based on the most recent Mortgage that was taken out on this home.
Original Mortgage
$150,000
Interest Rate
6.57%
Purchase Details
Closed on
Jun 10, 2003
Sold by
Crabb James R and Crabb Marie T
Bought by
Hoisak Jonathan P and Hoisak Cara C
Home Financials for this Owner
Home Financials are based on the most recent Mortgage that was taken out on this home.
Original Mortgage
$304,000
Interest Rate
4.05%
Purchase Details
Closed on
Sep 8, 1997
Sold by
Fratarcangeli Claudio and Fratarcangeli Lisa
Bought by
Crabb James R and Crabb Marie T
Purchase Details
Closed on
Oct 15, 1987
Sold by
Demartino Marjorie
Bought by
Fratarcangeli Claudia
Create a Home Valuation Report for This Property
The Home Valuation Report is an in-depth analysis detailing your home's value as well as a comparison with similar homes in the area
Home Values in the Area
Average Home Value in this Area
Purchase History
| Date | Buyer | Sale Price | Title Company |
|---|---|---|---|
| Walsh Patrick | $421,000 | -- | |
| Hoisak Jonathan P | $380,000 | -- | |
| Crabb James R | $202,500 | -- | |
| Fratarcangeli Claudia | $228,000 | -- |
Source: Public Records
Mortgage History
| Date | Status | Borrower | Loan Amount |
|---|---|---|---|
| Open | Fratarcangeli Claudia | $118,000 | |
| Closed | Fratarcangeli Claudia | $143,000 | |
| Closed | Fratarcangeli Claudia | $150,000 | |
| Previous Owner | Fratarcangeli Claudia | $304,000 |
Source: Public Records
Tax History
| Year | Tax Paid | Tax Assessment Tax Assessment Total Assessment is a certain percentage of the fair market value that is determined by local assessors to be the total taxable value of land and additions on the property. | Land | Improvement |
|---|---|---|---|---|
| 2025 | $10,381 | $282,520 | $142,310 | $140,210 |
| 2024 | $10,088 | $282,520 | $142,310 | $140,210 |
| 2023 | $9,927 | $282,520 | $142,310 | $140,210 |
| 2022 | $9,767 | $282,520 | $142,310 | $140,210 |
| 2021 | $8,283 | $227,780 | $118,580 | $109,200 |
| 2020 | $8,124 | $227,780 | $118,580 | $109,200 |
| 2018 | $7,942 | $227,780 | $118,580 | $109,200 |
| 2017 | $7,795 | $227,780 | $118,580 | $109,200 |
| 2016 | $7,594 | $227,780 | $118,580 | $109,200 |
| 2015 | $7,628 | $227,900 | $118,600 | $109,300 |
| 2014 | $7,466 | $227,900 | $118,600 | $109,300 |
Source: Public Records
Map
Nearby Homes
- 39 Zephyr Rd
- 0 Main St
- 13 Calhoun Ave
- 5940 Main St
- 253 Mayfield Dr Unit 253
- 177 Mayfield Dr
- 40 Rose Terrace
- 215 Fernwood Rd
- 230 Fitch Pass
- 440 Pitkin Hollow
- 43 Limerick Rd
- 75 Lilac Ln
- 184 Putting Green Rd
- 132 Merrimac Dr
- Lot 31 Valley View Rd
- 26 Grove St
- 15 Glenarden Rd
- 94 Grove St
- 5385 Main St
- 15 Squire Ct
Your Personal Tour Guide
Ask me questions while you tour the home.