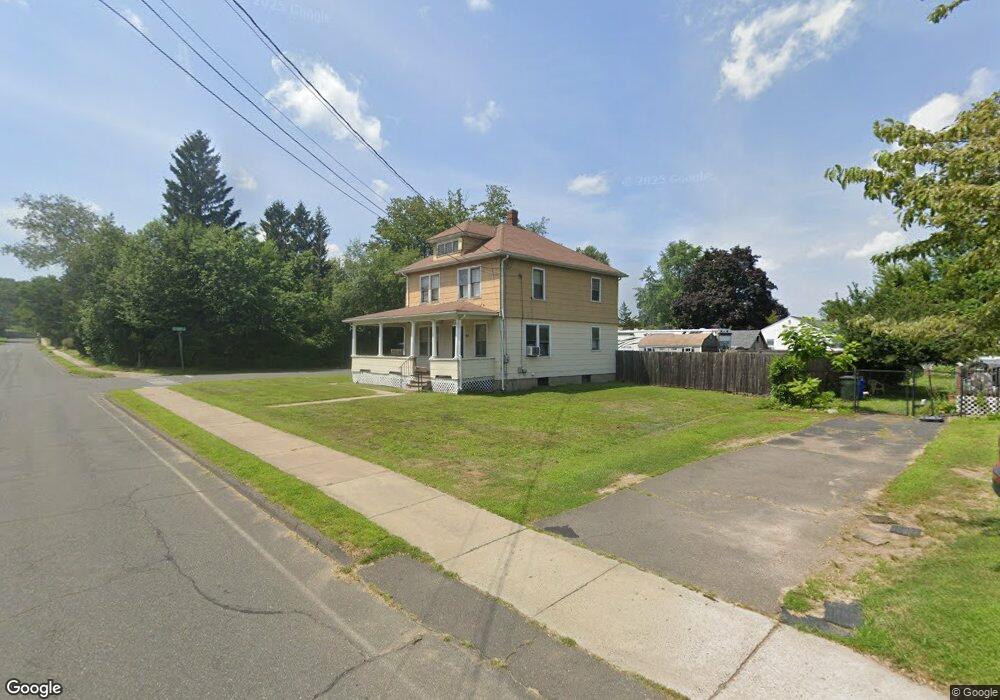
55 South St Windsor Locks, CT 06096
Estimated Value: $282,000 - $328,000
4
Beds
2
Baths
1,440
Sq Ft
$208/Sq Ft
Est. Value
About This Home
This home is located at 55 South St, Windsor Locks, CT 06096 and is currently estimated at $299,422, approximately $207 per square foot. 55 South St is a home located in Hartford County with nearby schools including North Street School, South Elementary School, and Windsor Locks Middle School.
Ownership History
Date
Name
Owned For
Owner Type
Purchase Details
Closed on
May 26, 2005
Sold by
Morris Wendy
Bought by
Brannigan Samuel and Brannigan Rejane
Current Estimated Value
Home Financials for this Owner
Home Financials are based on the most recent Mortgage that was taken out on this home.
Original Mortgage
$164,350
Outstanding Balance
$86,243
Interest Rate
5.94%
Estimated Equity
$213,179
Purchase Details
Closed on
Aug 18, 1997
Sold by
Pawlick Edward Jr Est
Bought by
Stclair Wendy and Stclair Barbara
Home Financials for this Owner
Home Financials are based on the most recent Mortgage that was taken out on this home.
Original Mortgage
$75,153
Interest Rate
2.75%
Mortgage Type
Unknown
Create a Home Valuation Report for This Property
The Home Valuation Report is an in-depth analysis detailing your home's value as well as a comparison with similar homes in the area
Home Values in the Area
Average Home Value in this Area
Purchase History
| Date | Buyer | Sale Price | Title Company |
|---|---|---|---|
| Brannigan Samuel | $167,000 | -- | |
| Stclair Wendy | $85,000 | -- |
Source: Public Records
Mortgage History
| Date | Status | Borrower | Loan Amount |
|---|---|---|---|
| Open | Stclair Wendy | $164,350 | |
| Previous Owner | Stclair Wendy | $29,900 | |
| Previous Owner | Stclair Wendy | $75,153 |
Source: Public Records
Tax History Compared to Growth
Tax History
| Year | Tax Paid | Tax Assessment Tax Assessment Total Assessment is a certain percentage of the fair market value that is determined by local assessors to be the total taxable value of land and additions on the property. | Land | Improvement |
|---|---|---|---|---|
| 2025 | $3,730 | $155,470 | $52,710 | $102,760 |
| 2024 | $2,665 | $94,710 | $37,100 | $57,610 |
| 2023 | $2,494 | $94,710 | $37,100 | $57,610 |
| 2022 | $2,446 | $94,710 | $37,100 | $57,610 |
| 2021 | $2,446 | $94,710 | $37,100 | $57,610 |
| 2020 | $2,446 | $94,710 | $37,100 | $57,610 |
| 2019 | $2,446 | $94,710 | $37,100 | $57,610 |
| 2017 | $2,885 | $108,200 | $39,700 | $68,500 |
| 2016 | $2,885 | $108,200 | $39,700 | $68,500 |
| 2015 | $2,899 | $108,200 | $39,700 | $68,500 |
| 2014 | $3,276 | $124,900 | $45,100 | $79,800 |
Source: Public Records
Map
Nearby Homes