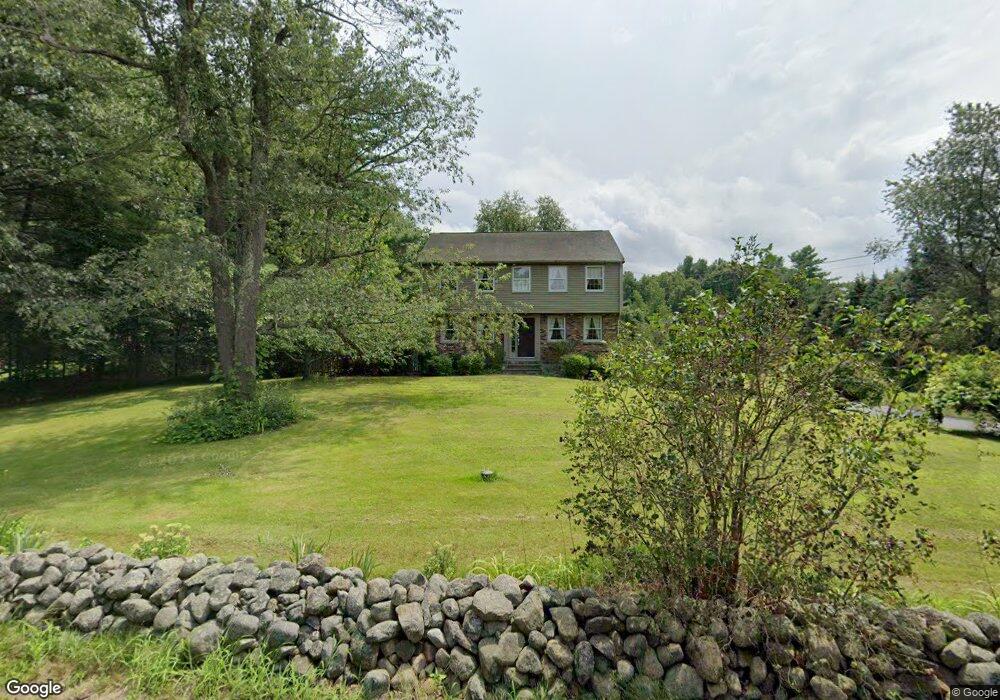
55 Spring St Wrentham, MA 02093
West Wrentham NeighborhoodEstimated Value: $724,568 - $964,000
3
Beds
3
Baths
1,986
Sq Ft
$405/Sq Ft
Est. Value
About This Home
This home is located at 55 Spring St, Wrentham, MA 02093 and is currently estimated at $803,642, approximately $404 per square foot. 55 Spring St is a home located in Norfolk County with nearby schools including Delaney Elementary School, Charles E Roderick, and Mercymount Country Day School.
Ownership History
Date
Name
Owned For
Owner Type
Purchase Details
Closed on
Jul 28, 1988
Sold by
Fleming Robert W
Bought by
Oatley Robert A
Current Estimated Value
Home Financials for this Owner
Home Financials are based on the most recent Mortgage that was taken out on this home.
Original Mortgage
$85,000
Interest Rate
10.39%
Mortgage Type
Purchase Money Mortgage
Create a Home Valuation Report for This Property
The Home Valuation Report is an in-depth analysis detailing your home's value as well as a comparison with similar homes in the area
Home Values in the Area
Average Home Value in this Area
Purchase History
| Date | Buyer | Sale Price | Title Company |
|---|---|---|---|
| Oatley Robert A | $214,000 | -- |
Source: Public Records
Mortgage History
| Date | Status | Borrower | Loan Amount |
|---|---|---|---|
| Closed | Oatley Robert A | $85,000 | |
| Previous Owner | Oatley Robert A | $80,000 |
Source: Public Records
Tax History Compared to Growth
Tax History
| Year | Tax Paid | Tax Assessment Tax Assessment Total Assessment is a certain percentage of the fair market value that is determined by local assessors to be the total taxable value of land and additions on the property. | Land | Improvement |
|---|---|---|---|---|
| 2025 | $7,291 | $629,100 | $288,100 | $341,000 |
| 2024 | $7,020 | $585,000 | $288,100 | $296,900 |
| 2023 | $6,666 | $528,200 | $262,000 | $266,200 |
| 2022 | $6,563 | $480,100 | $255,200 | $224,900 |
| 2021 | $6,272 | $445,800 | $238,500 | $207,300 |
| 2020 | $5,684 | $398,900 | $182,100 | $216,800 |
| 2019 | $5,494 | $389,100 | $182,100 | $207,000 |
| 2018 | $5,655 | $397,100 | $181,900 | $215,200 |
| 2017 | $5,528 | $387,900 | $178,400 | $209,500 |
| 2016 | $5,445 | $381,300 | $173,300 | $208,000 |
| 2015 | $5,343 | $356,700 | $166,600 | $190,100 |
| 2014 | $5,254 | $343,200 | $160,200 | $183,000 |
Source: Public Records
Map
Nearby Homes
- 50 Wamsutta Way
- 2095 West St
- 236 Williams St
- 60 Grant Ave
- 50 Heather Ln
- 25 Nature View Dr
- 20 Nature View Dr
- 39 Sumner Brown Rd
- 180 Pine Swamp Rd
- 56 Pine Swamp Rd
- 851 Washington St
- 17 Stanford Rd
- 10 Stanford Rd
- 9 Pebble Cir Unit 9
- 2 Duhamel Way
- 65 Palmetto Dr Unit 65
- 21 Palmetto Dr Unit 21
- 24 Palmetto Dr Unit 24
- 584 Washington St
- 219 Dawn Blvd